

The dust in the wheel: Can gravel riding trigger asthma?
Gravel dust acts as an irritant to the airways if you sit behind at the pack of the peloton.
Sitting at the back of a small group at Saimaa Gravel Tour 2025. Beautiful scenery alongside the Saimaa Canal. Dust was not an issue that day.
What hours of breathing road dust at racing ventilation may do to your airways, and who should care most
I got an email from a reader and active writer asking how dust rising from gravel roads would affect the airways, given that some riders already experience asthma-related respiratory symptoms. I was not aware of any studies on this and thought this is a good opportunity to learn also myself and dig deeper into the literature.
So, picture the back of a gravel peloton on an unpaved road, and a brown cloud that never settles because the wheels keep lifting it. Every rider in the bunch breathes that cloud, hard, for the whole race. The rider off the front on the same road meets almost clean air. Same effort with a completely different lungful.
It is well known and documented (Adar et al., 2014)(Rice et al., 2015) that air pollution in the long term is harmful for health, but would the acute effects of inhaled soil and road dust actually cause symptoms and possibly narrow your airways in that moment?
What is gravel dust, really?
Most of the suspended material is silt- and clay-sized, and, crucially, the faster the wheels travel the larger the fraction of very fine, respirable particles. It may also contain traces of tyre, brake and road-wear particles (Williams et al., 2008)(Wagner et al., 2024).
Those finest particles matter most, because they are the ones that slip past the larynx (the voice box) and reach the lungs and the small airways. They also carry a disproportionate load of reactive metals. In other words, the part of the dust cloud you cannot see is the part your airways care about.
Exercise multiplies the dose
Here is the twist that makes cycling different from standing at a roadside. You do not breathe a concentration, you breathe a dose, and dose is concentration multiplied by how hard you breathe multiplied by how long you are out there. At rest you move six to twelve litres of air per minute. Riding hard, that can exceed 100 litres per minute, and up to around 200 L/min in the biggest male athletes (Zuurbier et al., 2009)(Holmberg et al., 2007), and you switch to deep mouth breathing that bypasses the nose's filter. Over a multi-hour race those numbers compound brutally. The biological proof is blunt: urban cyclists carry roughly 2.3 times more black carbon in their airway cells than pedestrians on the same streets (Nwokoro et al., 2012).
And the two worst factors line up precisely in the bunch. Only there do you combine the highest ventilation with the highest in-cloud particle concentration. The solitary breakaway rider, breathing just as hard, inhales comparatively little. For a gravel field, the relevant exposure is not distant city smog, it is the dust of the wheel directly in front.
Could dust act like a clinical asthma provocation test?
This is the heart of it. In the clinic we provoke airways two ways. Direct agents such as methacholine act straight on the airway muscle. Indirect agents, like mannitol or dry air, do not touch the muscle at all; they trigger the airway's own machinery, releasing natural mediators and firing irritant nerves, which is why they are so specific for genuinely inflamed, twitchy asthmatic airways (Coates et al., 2017)(Anderson, 2016)(Hallstrand et al., 2018).
Inhaled dust belongs squarely in that indirect family, and mannitol is its closest cousin. Coarse, insoluble particles land on the airway lining and switch on irritant-sensing nerve channels (TRPA1 and TRPV1) on the vagus nerve (Bessac & Jordt, 2008)(Deering-Rice et al., 2015). That signal runs to the brainstem and returns as a reflex command to the airway muscle to contract.
The evidence is actually pretty old: back in 1962, inhaled inert dust was shown to cause reflex airway narrowing that was completely abolished by atropine, the drug that blocks that nerve pathway (Widdicombe et al., 1962). A substance acting directly on muscle cannot be switched off that way. Dust can. The same atropine-sensitive reflex shows up with other inhaled irritants, such as wood smoke (Hsu et al., 1998).
So dust does not behave like a chemical that clamps your airways shut directly. It behaves like an indirect challenge: it works through your own nervous system, and it leaves the airway more sensitive to the next provocation (Nordenhäll et al., 2001). That is exactly the profile of mannitol and its use as a provocation agent.
Who should care, and results from population studies
If coarse mineral dust really narrows reactive airways, the population numbers should show it, and they do. Natural desert-dust events are an accidental experiment. On Saharan-dust days, paediatric asthma emergency visits rose measurably with the coarse particle fraction (Cadelis et al., 2014), and desert dust over Athens was linked to a 38% rise in asthma emergencies (Trianti et al., 2017). Across multiple Mediterranean cities, the crustal, dust-derived coarse fraction, the very material a gravel rider inhales, carries a real, measurable acute respiratory signal (Stafoggia et al., 2016).
The reassuring half of the story: healthy lungs handle a hard, dusty ride with little measurable change in lung function (Cole et al., 2018). The effect concentrates in airways that are already inflamed and hyperreactive, that is, in riders with asthma, and especially those whose asthma is poorly controlled, who race in the bunch (McCreanor et al., 2007).
The honest bottom line
Here I have to be straight about the limits. No one has yet done the decisive experiment: take asthmatic volunteers, give them a standardised, measured dose of mineral dust, and compare the immediate drop in lung function head to head with mannitol, for example. Until that study exists, the case rests on converging lines of evidence, reflex physiology, exposure data and dust-storm epidemiology, that are strong and consistent but indirect.
What does that mean for you on the bike? If your airways are healthy, the dust is unlikely to make a difference to your ride (other than dirty clothes and the bike, of course), though the long-term pollution story is a separate conversation. If you have asthma and you race gravel in a bunch, you are very likely the person in whom this matters most. Optimise your control, talk to your doctor about a pre-exercise strategy tailored to your needs, and do not dismiss a nagging cough or a tight chest after dusty races as simply being unfit. The dust in the wheel in front of you is, physiologically, a good deal more than just dirt.
References
Adar, S. D., Filigrana, P. A., Clements, N., & Peel, J. L. (2014). Ambient Coarse Particulate Matter and Human Health: A Systematic Review and Meta-Analysis. Current Environmental Health Reports, 1(3), 258-274. https://doi.org/10.1007/s40572-014-0022-z
Anderson, S. D. (2016). 'Indirect' challenges from science to clinical practice. European Clinical Respiratory Journal, 3(1), 31096. https://doi.org/10.3402/ecrj.v3.31096
Bessac, B. F., & Jordt, S.-E. (2008). Breathtaking TRP Channels: TRPA1 and TRPV1 in Airway Chemosensation and Reflex Control. Physiology, 23(6), 360-370. https://doi.org/10.1152/physiol.00026.2008
Cadelis, G., Tourres, R., & Molinie, J. (2014). Short-Term Effects of the Particulate Pollutants Contained in Saharan Dust on the Visits of Children to the Emergency Department due to Asthmatic Conditions in Guadeloupe. PLoS ONE, 9(3), e91136. https://doi.org/10.1371/journal.pone.0091136
Coates, A. L., Wanger, J., Cockcroft, D. W., Culver, B. H., et al. (2017). ERS technical standard on bronchial challenge testing: general considerations and performance of methacholine challenge tests. European Respiratory Journal, 49(5), 1601526. https://doi.org/10.1183/13993003.01526-2016
Cole, C. A., Carlsten, C., Koehle, M., & Brauer, M. (2018). Particulate matter exposure and health impacts of urban cyclists: a randomized crossover study. Environmental Health, 17(1). https://doi.org/10.1186/s12940-018-0424-8
Deering-Rice, C. E., Shapiro, D., Romero, E. G., et al. (2015). Activation of Transient Receptor Potential Ankyrin-1 by Insoluble Particulate Material and Association with Asthma. American Journal of Respiratory Cell and Molecular Biology, 53(6), 893-901. https://doi.org/10.1165/rcmb.2015-0086OC
Hallstrand, T. S., Leuppi, J. D., Joos, G., et al. (2018). ERS technical standard on bronchial challenge testing: pathophysiology and methodology of indirect airway challenge testing. European Respiratory Journal, 52(5), 1801033. https://doi.org/10.1183/13993003.01033-2018
Holmberg, H.-C., Rosdahl, H., & Svedenhag, J. (2007). Lung function, arterial saturation and oxygen uptake in elite cross country skiers: influence of exercise mode. Scandinavian Journal of Medicine & Science in Sports, 17(4), 437-444. https://doi.org/10.1111/j.1600-0838.2006.00592.x
Hsu, T. H., Lai, Y.-L., & Kou, Y. R. (1998). Smoke-induced airway hyperresponsiveness to inhaled wood smoke in guinea pigs: Tachykininergic and cholinergic mechanisms. Life Sciences, 63(17), 1513-1524. https://doi.org/10.1016/s0024-3205(98)00418-4
McCreanor, J., Cullinan, P., Nieuwenhuijsen, M. J., et al. (2007). Respiratory Effects of Exposure to Diesel Traffic in Persons with Asthma. New England Journal of Medicine, 357(23), 2348-2358. https://doi.org/10.1056/NEJMoa071535
Nordenhäll, C., Pourazar, J., Ledin, M.-C., et al. (2001). Diesel exhaust enhances airway responsiveness in asthmatic subjects. European Respiratory Journal, 17(5), 909-915. https://doi.org/10.1183/09031936.01.17509090
Nwokoro, C., Ewin, C., Harrison, C., et al. (2012). Cycling to work in London and inhaled dose of black carbon. European Respiratory Journal, 40(5), 1091-1097. https://doi.org/10.1183/09031936.00195711
Rice, M. B., Ljungman, P. L., Wilker, E. H., et al. (2015). Long-Term Exposure to Traffic Emissions and Fine Particulate Matter and Lung Function Decline in the Framingham Heart Study. American Journal of Respiratory and Critical Care Medicine, 191(6), 656-664. https://doi.org/10.1164/rccm.201410-1875OC
Stafoggia, M., Zauli-Sajani, S., Pey, J., et al., the MED-PARTICLES Study Group (2016). Desert Dust Outbreaks in Southern Europe: Contribution to Daily PM10 Concentrations and Short-Term Associations with Mortality and Hospital Admissions. Environmental Health Perspectives, 124(4), 413-419. https://doi.org/10.1289/ehp.1409164
Trianti, S.-M., Samoli, E., Rodopoulou, S., Katsouyanni, K., Papiris, S. A., & Karakatsani, A. (2017). Desert dust outbreaks and respiratory morbidity in Athens, Greece. Environmental Health, 16(1). https://doi.org/10.1186/s12940-017-0281-x
Wagner, S., Funk, C. W., Müller, K., & Raithel, D. J. (2024). The chemical composition and sources of road dust, and of tire and road wear particles, A review. Science of The Total Environment, 926, 171694. https://doi.org/10.1016/j.scitotenv.2024.171694
Widdicombe, J. G., Kent, D. C., & Nadel, J. A. (1962). Mechanism of bronchoconstriction during inhalation of dust. Journal of Applied Physiology, 17(4), 613-616. https://doi.org/10.1152/jappl.1962.17.4.613
Williams, D. S., Shukla, M. K., & Ross, J. (2008). Particulate matter emission by a vehicle running on unpaved road. Atmospheric Environment, 42(16), 3899-3905. https://doi.org/10.1016/j.atmosenv.2008.02.003
Zuurbier, M., Hoek, G., Hazel, P. V. D., & Brunekreef, B. (2009). Minute ventilation of cyclists, car and bus passengers: an experimental study. Environmental Health, 8(1). https://doi.org/10.1186/1476-069X-8-48

Treadmill VO₂ & Session Builder – from skier’s spreadsheet to a browser tool
Plan smart treadmill workouts with VO₂-based intervals, running economy slider and exportable sessions – a lab-inspired tool for everyday runners
I’m planning future projects on exhaled air temperature and humidity, and a controllable indoor setup is almost mandatory for that. That is why I bought a Technogym MyRun treadmill.
Before you can do “real” research on a device, you have to live with it a bit. So I started by doing what I’ve done as a former cross-country skier: building treadmill workouts and trying to understand what’s happening physiologically and get a fell for a new device.
That is where this treadmill VO₂ calculator and session builder comes from.
The page is essentially a developed and fine-tuned browser version of a scrappy Excel sheet I first built years ago as an athlete. Now it’s cleaner, easier to use, and available for anyone who wants to plan treadmill sessions with a bit more structure than “5.00 min/km until it feels bad”.
The original Excel: locking a session to a VO₂ target
During my skiing years, most of my treadmill sessions were uphill. Flat treadmill running is nice, but if you want to get into race-specific territory for cross-country skiing to activate the muscles differently, you end up at 4–10% inclines pretty quickly.
Because I had done several laboratory VO₂max tests, I knew roughly my VO₂max and lactate thresholds. When I sat down to design a workout, I often thought in VO₂ rather than only speed:
“Let’s say I want to spend 4 × 6 minutes at around 55 mL/kg/min. If I choose 6% incline, what should the speed be?”
The problem: treadmills show speed and incline, not VO₂. So I built a simple spreadsheet to do the conversion:
Input: speed, incline, body mass
Output: estimated VO₂, METs, distance, energy, etc.
Then I’d reverse it: fix VO₂ and incline, solve for speed.
I’d print the sheet or take a screenshot and put it near the treadmill and do the session. It was crude but surprisingly helpful – and it’s exactly the logic that now lives inside this web calculator.
From spreadsheet to treadmill VO₂ calculator
The new Treadmill VO₂ & Session Builder keeps the same core idea but wraps it into something you can actually use.
You set body mass and a running economy adjustment (more on that later)
For each interval you add:
Speed (or pace in min/km)
Incline (%)
Duration or distance
The calculator estimates:
VO₂ (mL/kg/min)
METs
Distance, elevation gain, energy (kcal)
You can then:
Lock VO₂ and solve for speed or incline (e.g. “45 mL/kg/min at 7% – what speed?”).
Build a full session interval by interval.
See total duration, distance, elevation, mean VO₂, mean speed and total calories.
Export the whole thing as TXT, PDF or Excel and take it with you to the treadmill.
I usually keep an iPad next to the MyRun. The exported session sits on the screen while Zwift or another app records the run in the background. It’s a small thing, but being able to see “this rep is meant to be ~50 mL/kg/min” is a very nice mental anchor.
The running economy slider: useful, but wrong in many ways
One new feature compared to my old Excel file is the running economy adjustment slider. This is where we immediately run into trouble from a physiology point of view.
Running economy is, roughly, “how much oxygen you need to run at a given submaximal speed.” Two runners can have the same VO₂max but very different economy, so at 4:30 min/km one might be cruising and the other suffering.
The slider in the calculator lets you scale VO₂ up or down relative to a “typical trained runner”:
90% = very economical (lower VO₂ at a given speed)
100% = typical club-level runner
110% = poor economy (higher VO₂ at a given speed)
Scientifically, a single slider is absolutely an oversimplification:
Economy depends on anthropometry, tendon stiffness, technique, strength, footwear, fatigue, probably even mood and caffeine.
It drifts with session duration, training status, temperature and many other factors.
To really know your profile, you’d need lab measurements at multiple submaximal speeds, not a guess from an internet calculator.
So why include it?
Because it’s a useful teaching and comparison tool.
The underlying equations give you VO₂ for a theoretical “average” runner. The slider simply says: “OK, but what if you’re a bit better or worse than that?” It lets you personalise the numbers enough that the sessions make sense for you, without pretending that we know your physiology exactly.
Where my slider sits and why
A bit of context about my own fitness level, so you see what the numbers mean in practice.
At the time of writing, I’m a moderate runner. My recent 3000 m test is around 10:30, so I’m nowhere near elite, but not a complete beginner either.
In a recent VO₂max test as part of a research study at the University of Jyväskylä, my first lactate / ventilatory threshold (LT1) was:
Pace about 4:48 min/km
VO₂ around 43 mL/kg/min
Incline at 1%
If I plug that into the calculator and try to make the model match those numbers, my slider ends up around 93–94% – slightly more economical than the “typical trained runner” that the equations assume.
For longer steady runs, it’s probably more realistic to use something like 95–96%, because fatigue and biomechanics over 90–120 minutes are not the same as during a short lab stage. When I build my own treadmill sessions, my slider usually lives between 96–98%, depending on how optimistic I’m feeling.
That’s also how I recommend readers treat it:
Use the slider to roughly align the model with what you see in your own testing, races or perceived effort.
Don’t obsess about whether you are a 95% or a 97% person. The difference is smaller than the day-to-day variation in your legs.
How I actually use the treadmill VO₂ session builder
At the moment I’m still in the “getting to know the tool” phase. Over the past winter I’ve been doing roughly 3–4 treadmill sessions per week, partly to get used to the MyRun and partly to see where the calculator behaves nicely and where it doesn’t.
A typical structured session for me might look like this:
15–20 min easy warm-up
4–6 × 5 min uphill, with:
VO₂ locked in around, say, 50–55 mL/kg/min
First interval at lower incline and higher speed
Later intervals at higher incline and slightly lower speed, but same VO₂
Easy running between the intervals
Cool-down
The calculator helps me answer questions like:
“If I want all reps to feel like the same metabolic load, how do I trade speed and incline against each other?”
“How much elevation did I actually climb during this workout?”
“If I know the mean VO₂ and my body mass, how many calories did this session roughly cost?”
On some days I also play with stepwise VO₂ progressions: each interval 2–3 mL/kg/min harder than the previous one, keeping the incline constant and adjusting only speed. It’s a nice way to build a controlled ramp without needing a lab protocol.
Comparing sessions: same VO₂, different story
One reason I wanted this calculator public is to show how different two treadmill sessions can be even if the average VO₂ is the same.
For example, imagine two 5-minute intervals at roughly 50 mL/kg/min:
Session A: moderate incline, moderate speed
Session B: steeper incline, slower speed, same VO₂
Metabolically they’re similar, but mechanically they are not:
Higher incline shifts emphasis towards the posterior chain and feels more like a skiing uphill.
Higher speed with less incline feels more like flat road running, with different coordination and impact patterns.
If you lock the VO₂ at 50 mL/kg/min in the calculator and start moving the incline up and speed down (or vice versa), you see this trade-off numerically. For coaches and self-coached runners, that’s valuable: you can build sessions that are metabolically comparable but specific to the sport or race you care about.
For coaches and hobby runners
I see two main user groups for this treadmill VO₂ calculator.
Coaches and serious athletes
Build a session once, export it to PDF or Excel, and share it with athletes.
“Lock” sessions to VO₂ targets and then adjust for each athlete using a personalised running economy slider
Use the summary row to quickly see how much time an athlete spends near certain VO₂ or MET ranges.
Curious hobby runners
If you’ve just finished a C25K (couch to 5 kilometers) plan or are doing your first structured intervals, the simplest way to use the tool is:
Ignore VO₂ at first and just set your usual speeds and inclines.
Enter your body mass.
Use the calculator to see the estimated VO₂ and calories and how small changes (like +1% incline) move them.
Over time, as you get race results or maybe a lab test, you can start to fine-tune the slider and think in VO₂ terms. But you don’t need to be a physiologist on day one.
How this fits with wearables and apps
Right now my own workflow looks like this:
Plan the workout in the treadmill session builder.
Export as TXT or PDF and open it on an iPad or similar next to the treadmill.
Record the actual run with Zwift (or your preferred app) so the session goes into Garmin / Strava / other platforms.
Export the screenshot with comments to the training log or as Zwift media.
Longer term, one interesting direction would be to generate a .FIT file or similar export directly from the calculator, so you could load the session as a structured workout to your watch or bike computer. That’s not implemented yet, but the structure is there: the calculator already knows every interval, speed and incline.
If you are a developer or heavy user of training software and have opinions on the best export formats, I’d be happy to hear them.
Research side: VO₂, ventilation and heating the air you breathe
The treadmill and this calculator are also part of a bigger research puzzle I’m working on. In simple terms, I’m exploring the relationship between heart rate and ventilation:
If your heart rate is 140 bpm, is ventilation always, say, 80 L/min? (for me it was on VO₂max test)
How much does that relationship change between people and within the same person over time?
The long-term goal is to build a larger model of ventilation and, from that, estimate how much air needs to be heated and humidified by the airways during exercise. This matters for understanding airway stress, especially in cold or dry environments – something that keeps coming up in both asthma and endurance sports.
The treadmill VO₂ calculator is a small building block in this larger project:
It helps me design standardised treadmill sessions for participants, matched to a percentage of their VO₂max (for example, a 120-minute run at ~65% VO₂max).
It gives a structured way to connect treadmill settings with physiological estimates, which then link to ventilation and airway measurements.
So while the calculator is free to use and meant for everyday training, there is a fairly nerdy research agenda hiding behind it.
Safety, limitations and how to “play” with it
A few important points:
This is not a clinical device. It won’t diagnose anything and it won’t replace medical advice.
The VO₂ values are estimates based on standard equations plus the economy slider, not measured gas exchange.
If you have symptoms (chest pain, worrying breathlessness, severe wheeze, etc.), the right place to start is healthcare, not a new treadmill workout.
That said, I built this tool precisely to encourage curiosity:
Change the incline and see how VO₂ and elevation gain react.
Lock VO₂ and experiment with different combinations of speed and gradient.
Try a more economical slider and see what would have to be true for you to “behave” like an elite runner.
Treat it as a way to connect what you feel on the treadmill with some numbers and concepts from exercise physiology, not as a strict prescription engine.
What’s next – and suggestions welcome
This treadmill VO₂ calculator is a second tool after cycling energy consumption calculator in what I hope will become a small collection of sports physiology calculators on this site. Things I’m actively exploring include:
Tools around heart rate–ventilation relationships
Ventilation, inspired volume and airway heating/humidification estimates
If there is a calculator you wish existed – something you repeatedly do in a spreadsheet or on the back of an envelope – I’d be happy to hear about it.
You can find the treadmill VO₂ & session builder under rikhard.fi/calculators. Use it, break it, send feedback, and most importantly: enjoy your time on the treadmill, whether you’re chasing VO₂ numbers or just trying to get through a Finnish winter in one piece.
—
Rikhard
Cold-weather limits in cross-country skiing – is -20°C too cold?
What are appropriate temperature limits for cross-country ski races? I propose that for adults, the frost limit be set at -17°C, and for those under 16 years old, the existing limit of -15°C is good. Additionally, I will outline the impact of masks on exercise performance.
Shortened version published as a guest column on November 18th 2025 at hiihtokokki.fi
The first races of the early season have been skied in the North. I spent ten days with Team Electrofit: we tested plenty of skis, gave flu vaccinations, and the speed looked promising heading toward Ruka.
In Sunday’s races in Olos, the weather was a bit brisker, about –10 to –12 °C, even though it was –25 °C down in the village of Muonio, thanks to an inversion caused by the fell weather. This phenomenon is familiar to many who spend time outdoors in the North, and there was no need to fear that the race would be cancelled or that the skiers’ safety would be at risk.
Cross-country skiing, Nordic combined, and biathlon are exceptional Olympic sports. Before ski mountaineering joins the Olympics next winter, they have been the only endurance sports in which competitions are held clearly below freezing. Cold air is part of the nature of the sport, but somewhere there is a threshold where the health risk may become greater than the athletic benefit. At the moment, FIS competition rules state that a race can be held if the coldest point on the course is –20 °C or warmer. Wind conditions must also be taken into account.
Cold affects the whole body during exercise, and the topic is very broad. In this text, I focus on how cold air affects the airways during competition.
What does cold do to the airways?
In high-intensity endurance exercise, the lungs ventilate 100–200 litres per minute. In freezing conditions, the inhaled air is very cold and dry. When cold and dry air flows quickly through the airways, it cools the mucous membranes, dries out the airways, and loads the bronchi both mechanically and chemically.
In the long term, this may increase the risk of developing asthma. A clear causal relationship has not, however, been established, but we do know well that especially cross-country skiers have more asthma than the general population. It would appear that asthma does not develop in a single race, but even a single bout of intense exertion in cold air can irritate the airways for several days.
What do skiers themselves think about cold-weather limits?
As part of my PhD project, we conducted a survey on the respiratory health of Finnish cross-country skiers in spring 2019. As a small but interesting part of the questionnaire, we also asked athletes’ own opinions about temperature limits for competition. The results were published in summary form on the hengitystutkimus.fi website. (link)
What did we find? (351 respondents)
66% of skiers said they always compete if the race is held.
When we looked at athletes over 16 years of age (for whom the FIS -20 °C limit practically applies), only 13% considered -20 °C or colder to be an appropriate temperature limit.
On average, the temperature limits considered appropriate were:
-16.8 °C for those over 16
-15.1 °C for those under 16
In other words, most athletes would prefer a warmer limit than the current -20 °C. In my view, this is an important message. Athletes understand that cold is part of the sport, but they do not want to compete at any cost.
After the survey but before the results were published, the Finnish Ski Association had already raised the temperature limit in Finland to –15 °C, which essentially corresponds to the average opinion among young skiers. In the Scandinavia Cup for adults, a stricter –17 °C limit has been used since the 2016–2017 season, and this has been applied several times since.
Sprint, distance, and long races – should the limits differ?
Two perspectives have come up in discussions with athletes and colleagues:
Sprint races in severe cold feel harsher on the airways for many athletes, because skiing speed and intensity are at or even above maximal oxygen uptake, and for those who reach the final this is repeated four times in a day.
Distance and long races involve a longer exposure, and although the speed is not as high, the total duration of exposure is very long and the exposure of the rest of the body must also be considered.
The combination of duration and intensity determines both the load on the airways and the risk of frostbite. The current single -20 °C limit for all competition formats does not take this into account.
Personally, I think it would be reasonable to consider warmer limits in sprint races. In long-distance races (e.g. 50 km and mass-start long-distance events), special attention should be paid to frostbite and hypothermia risk (for example fingers, toes, face, genitals).
Why isn’t there research to define the “right” temperature limit?
Let’s imagine we make skiers ski hard at different sub-zero temperatures, measure body temperature, inflammatory markers, lung function, and then conclude that “from this temperature down, competition is not allowed”.
In practice, such a study would be almost impossible ethically. Participants cannot be deliberately exposed to conditions that are expected to cause mucosal damage or frostbite. The risk of severe frostbite injuries is not acceptable, even if the participants volunteer. Ethics committees would likely not approve study designs where the harm is so clearly foreseeable.
Another option in scientific terms would be opportunistic research: go to races that are already being held in very cold conditions and perform measurements before the start, during the race with wearable sensors, and immediately at the finish (e.g. spirometry, blood biomarkers, body temperature).
This could be challenging in practice but would be possible with good resources. It would be a burden on the athletes, and for example, several spirometers would be needed at the finish. In addition, the variables measured are often quite noisy and variable, so differences between temperatures might not be detectable in individual races.
Breathing masks and protecting the lungs
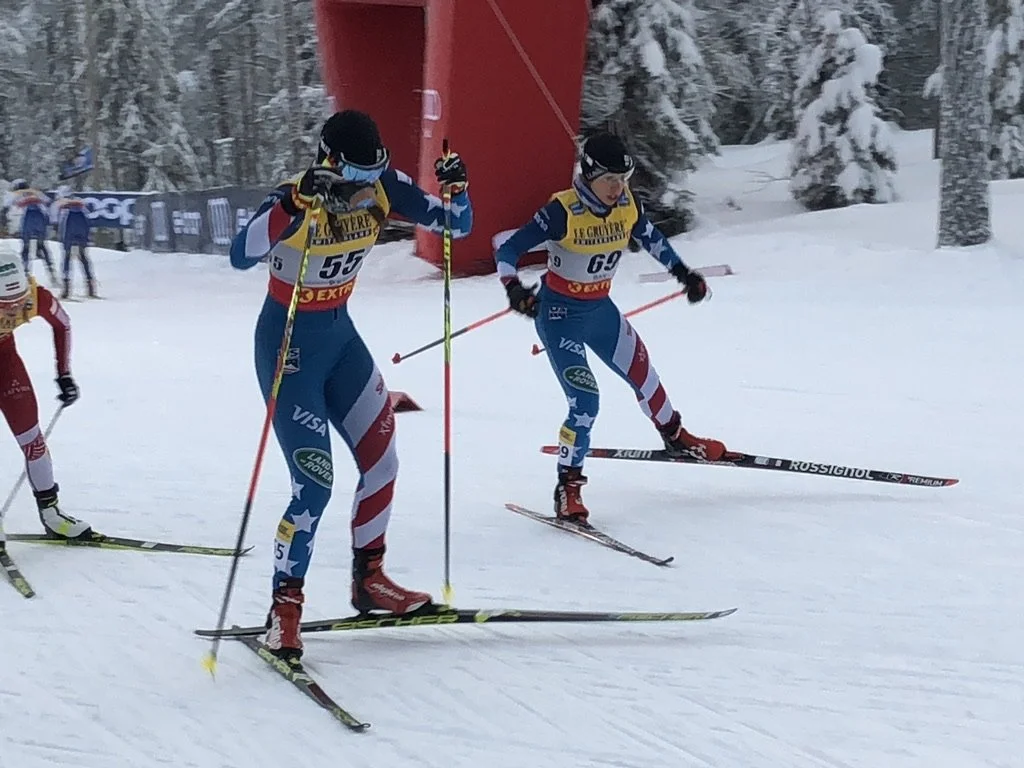
One way to protect the airways in cold is to use heat-exchanger masks (Airtrim, Jonasmask, etc.). In a Swedish study, it was observed that in a 4-minute maximal effort while skiing (similar to a sprint prologue) at -15 °C, lung function did not deteriorate after the effort when a breathing mask was used, compared with skiing without a mask.
Even with a good mask, breathing is harder work, and in a long race the accumulation of moisture and its freezing increases breathing resistance. For this reason, not all athletes like the feeling of a mask or feel that it interferes with breathing. Nonetheless, I strongly recommend trying masks in cold conditions.

Figure. Julia Kern (bib 55) wearing an Airtrim mask on the final day of the Ruka World Cup in 2019, where she finished 55th. Since then, she has won silver and bronze in the team sprint at the World Championships.
Frostbite risk
In discussions about cold-weather limits, we cannot ignore peripheral circulation and frostbite injuries. In cold weather, for example at -20 °C, the risk of frostbite is on a completely different level than at -10 °C, especially if it is windy. In Ski Classics races, we have seen severe frostbite injuries and even amputations.
When it comes to preventing frostbite injuries, individual athletes’ choices are not enough. Even if an athlete wants to compete at any cost, organizers and rules are responsible for ensuring that no one is exposed to an unreasonable risk.
My proposal
Combining the load on the airways, frostbite risks, and athletes’ own views on cold-weather limits, I would propose the following rule changes:
For seniors, -17 °C would be a better-justified general limit than the current -20 °C. This is already in use in the Scandinavia Cup.
For juniors under 16, -15 °C is an appropriate limit and is already used in Finland.
In long races (e.g. 50 km and mass-participation long-distance races), not only temperature but also the effect of wind should be carefully assessed.
The purpose of the rules is not to turn skiing into an indoor sport; cold is part of the nature of the discipline. However, rules can help ensure that the responsibility for deciding whether it is safe to start does not rest solely on the individual athlete in conditions that may be harmful to health. Athletes’ health and safety can be better protected than at present, without cross-country skiing losing its character as a winter sport.
Rikhard
A Week at the World Athletics Championships in Tokyo 2025
A week of world-class athletics, a Duplantis world record from fifteen metres away, beef tonkatsu that haunts me still, and onsens in Hakone.
I had no official role in Tokyo. No badge, no media pass, no team to tend to. I went with a group of friends, bought tickets like everyone else, and spent a week doing exactly what I wanted: watching world-class athletics (for the first time), running through unfamiliar streets, and eating far too well.
This was my second time in Japan. I visited in 2024 and liked it so much that the World Championships felt like the perfect excuse to come back. It did not disappoint.
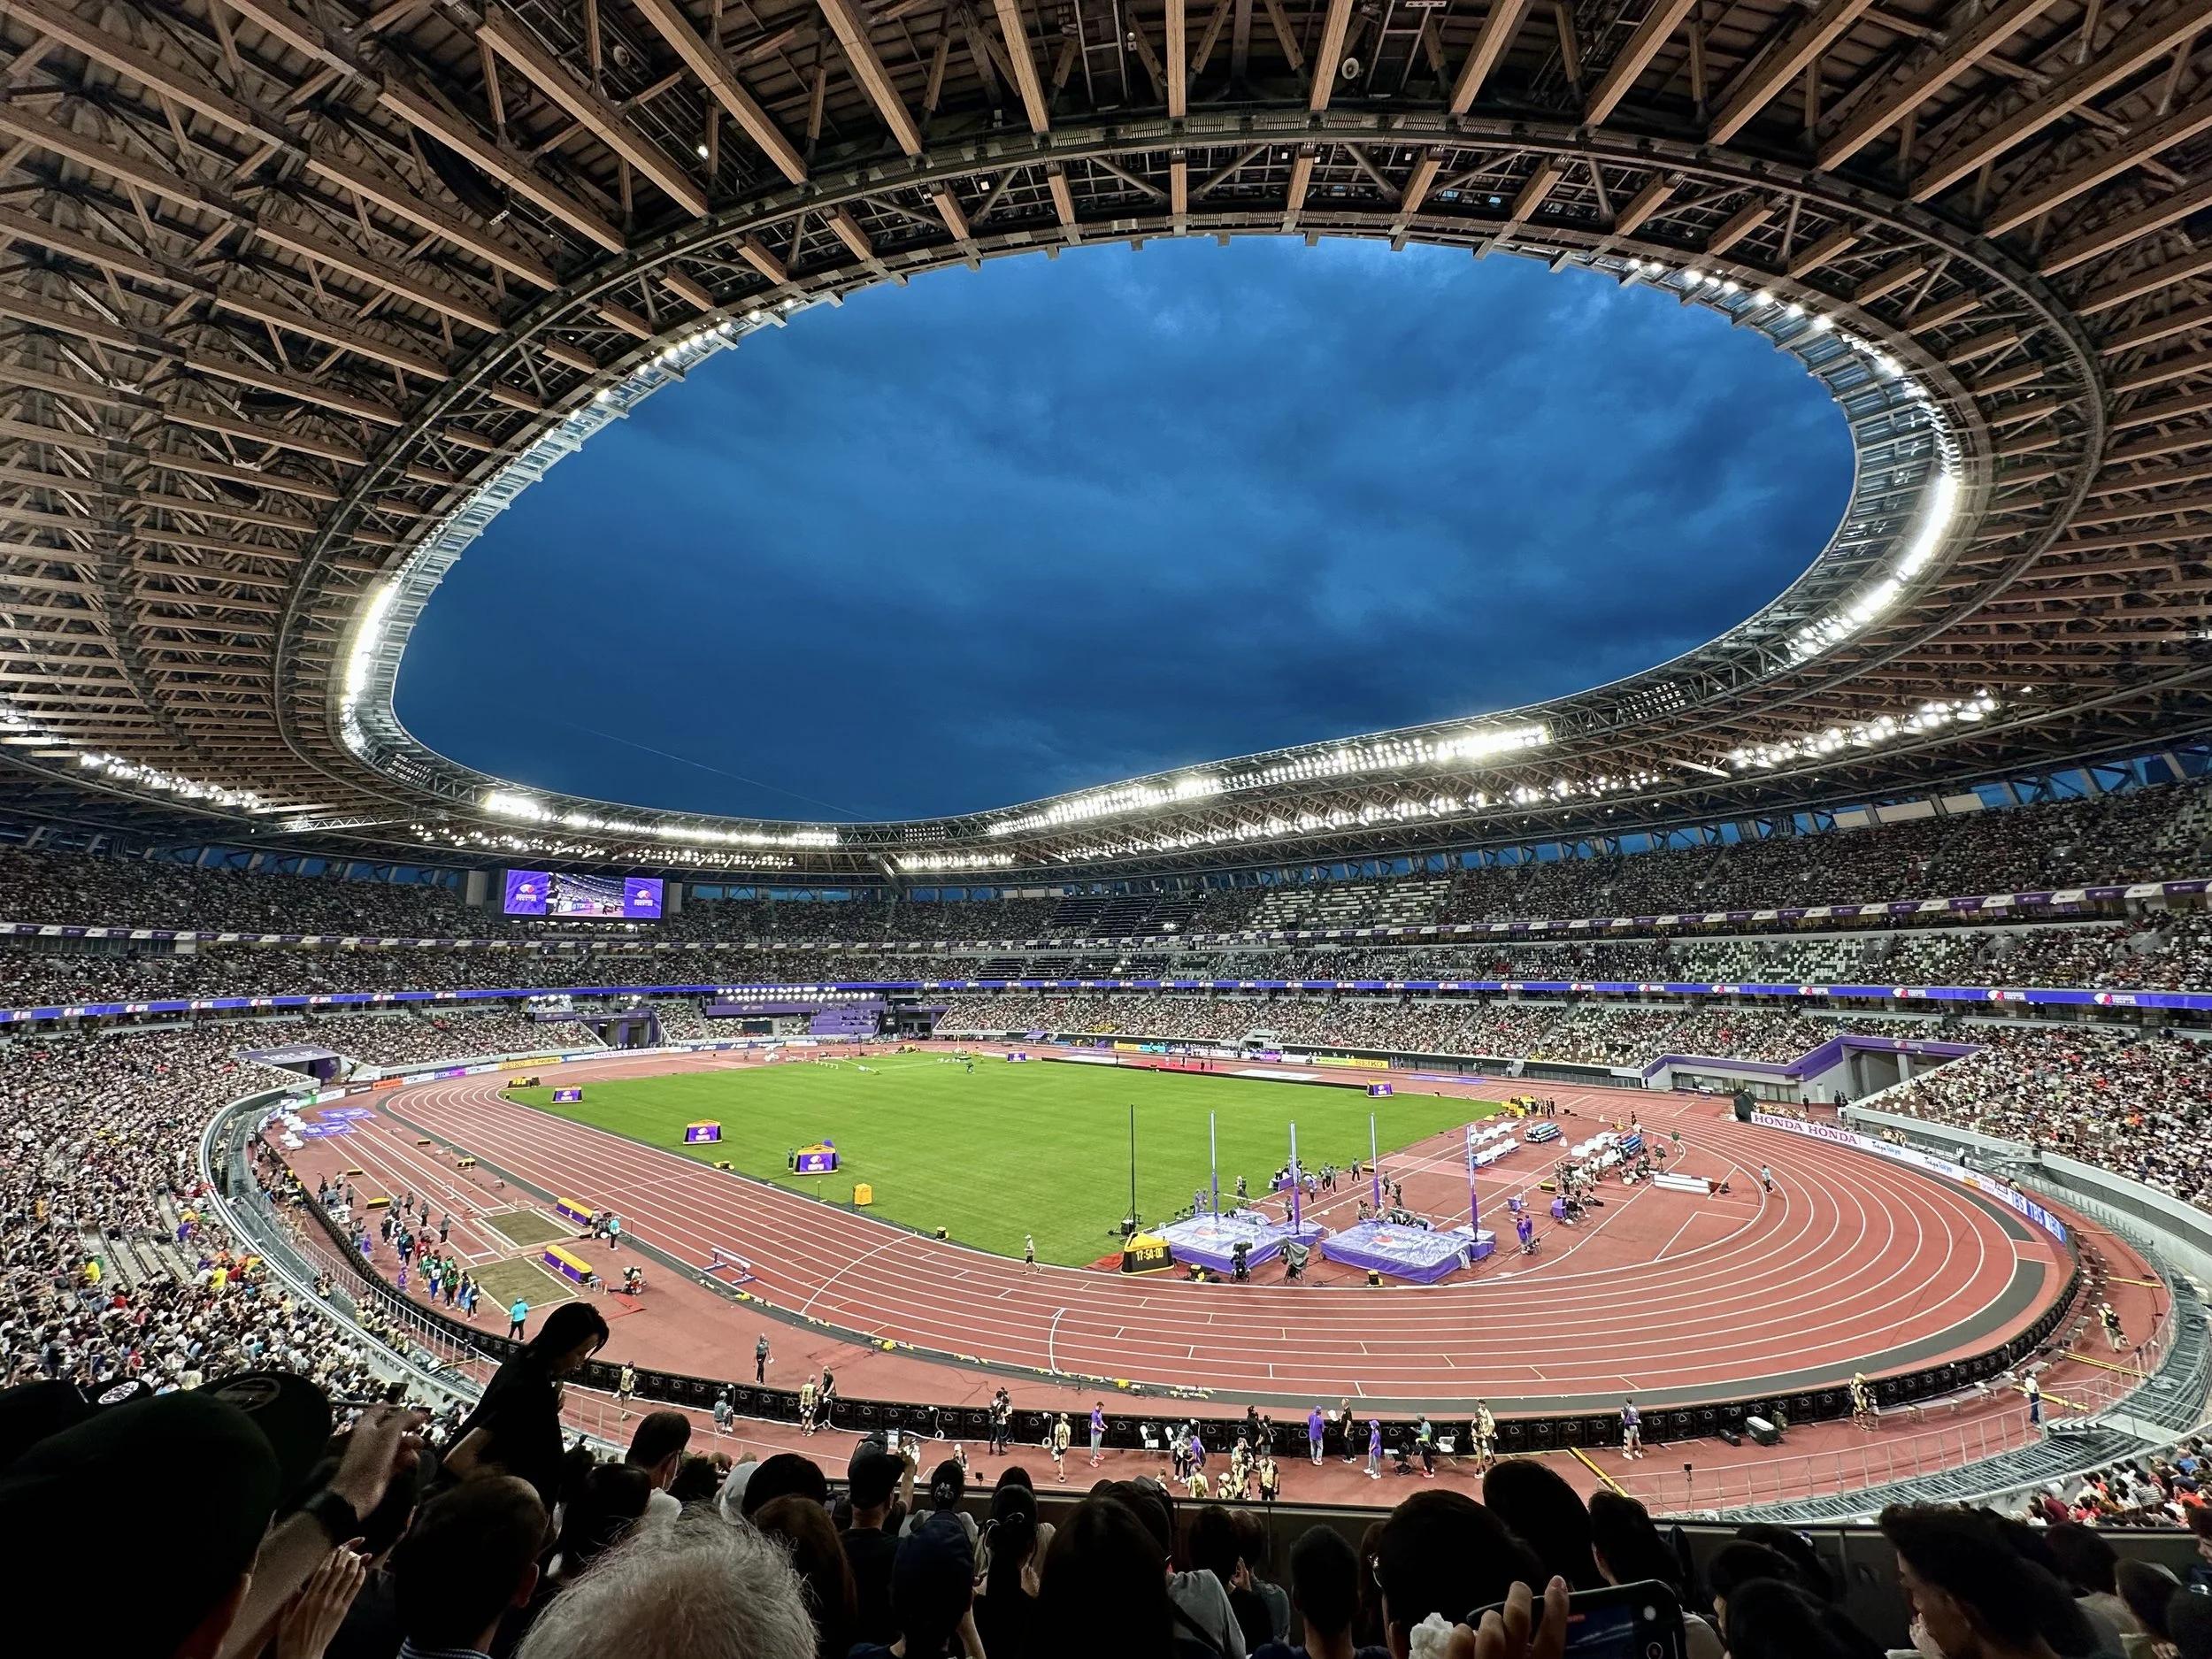
The stadium
The Japan National Stadium is something else. Built for the 2020 Olympics, it has a layered wooden roof that frames the sky like an enormous eye and lots of greenery on the outside.
We went big in Japan and attended four competition night sessions. The men's 100 metres from right beside the finish line. Both pole vault finals from right behind the mattress. And, when buying the tickets, the men's 3000 metre steeplechase — where Finland's Topi Raitanen would have been entered. Raitanen, unfortunately, was injured and did not compete. A disappointment, but that is elite sport.
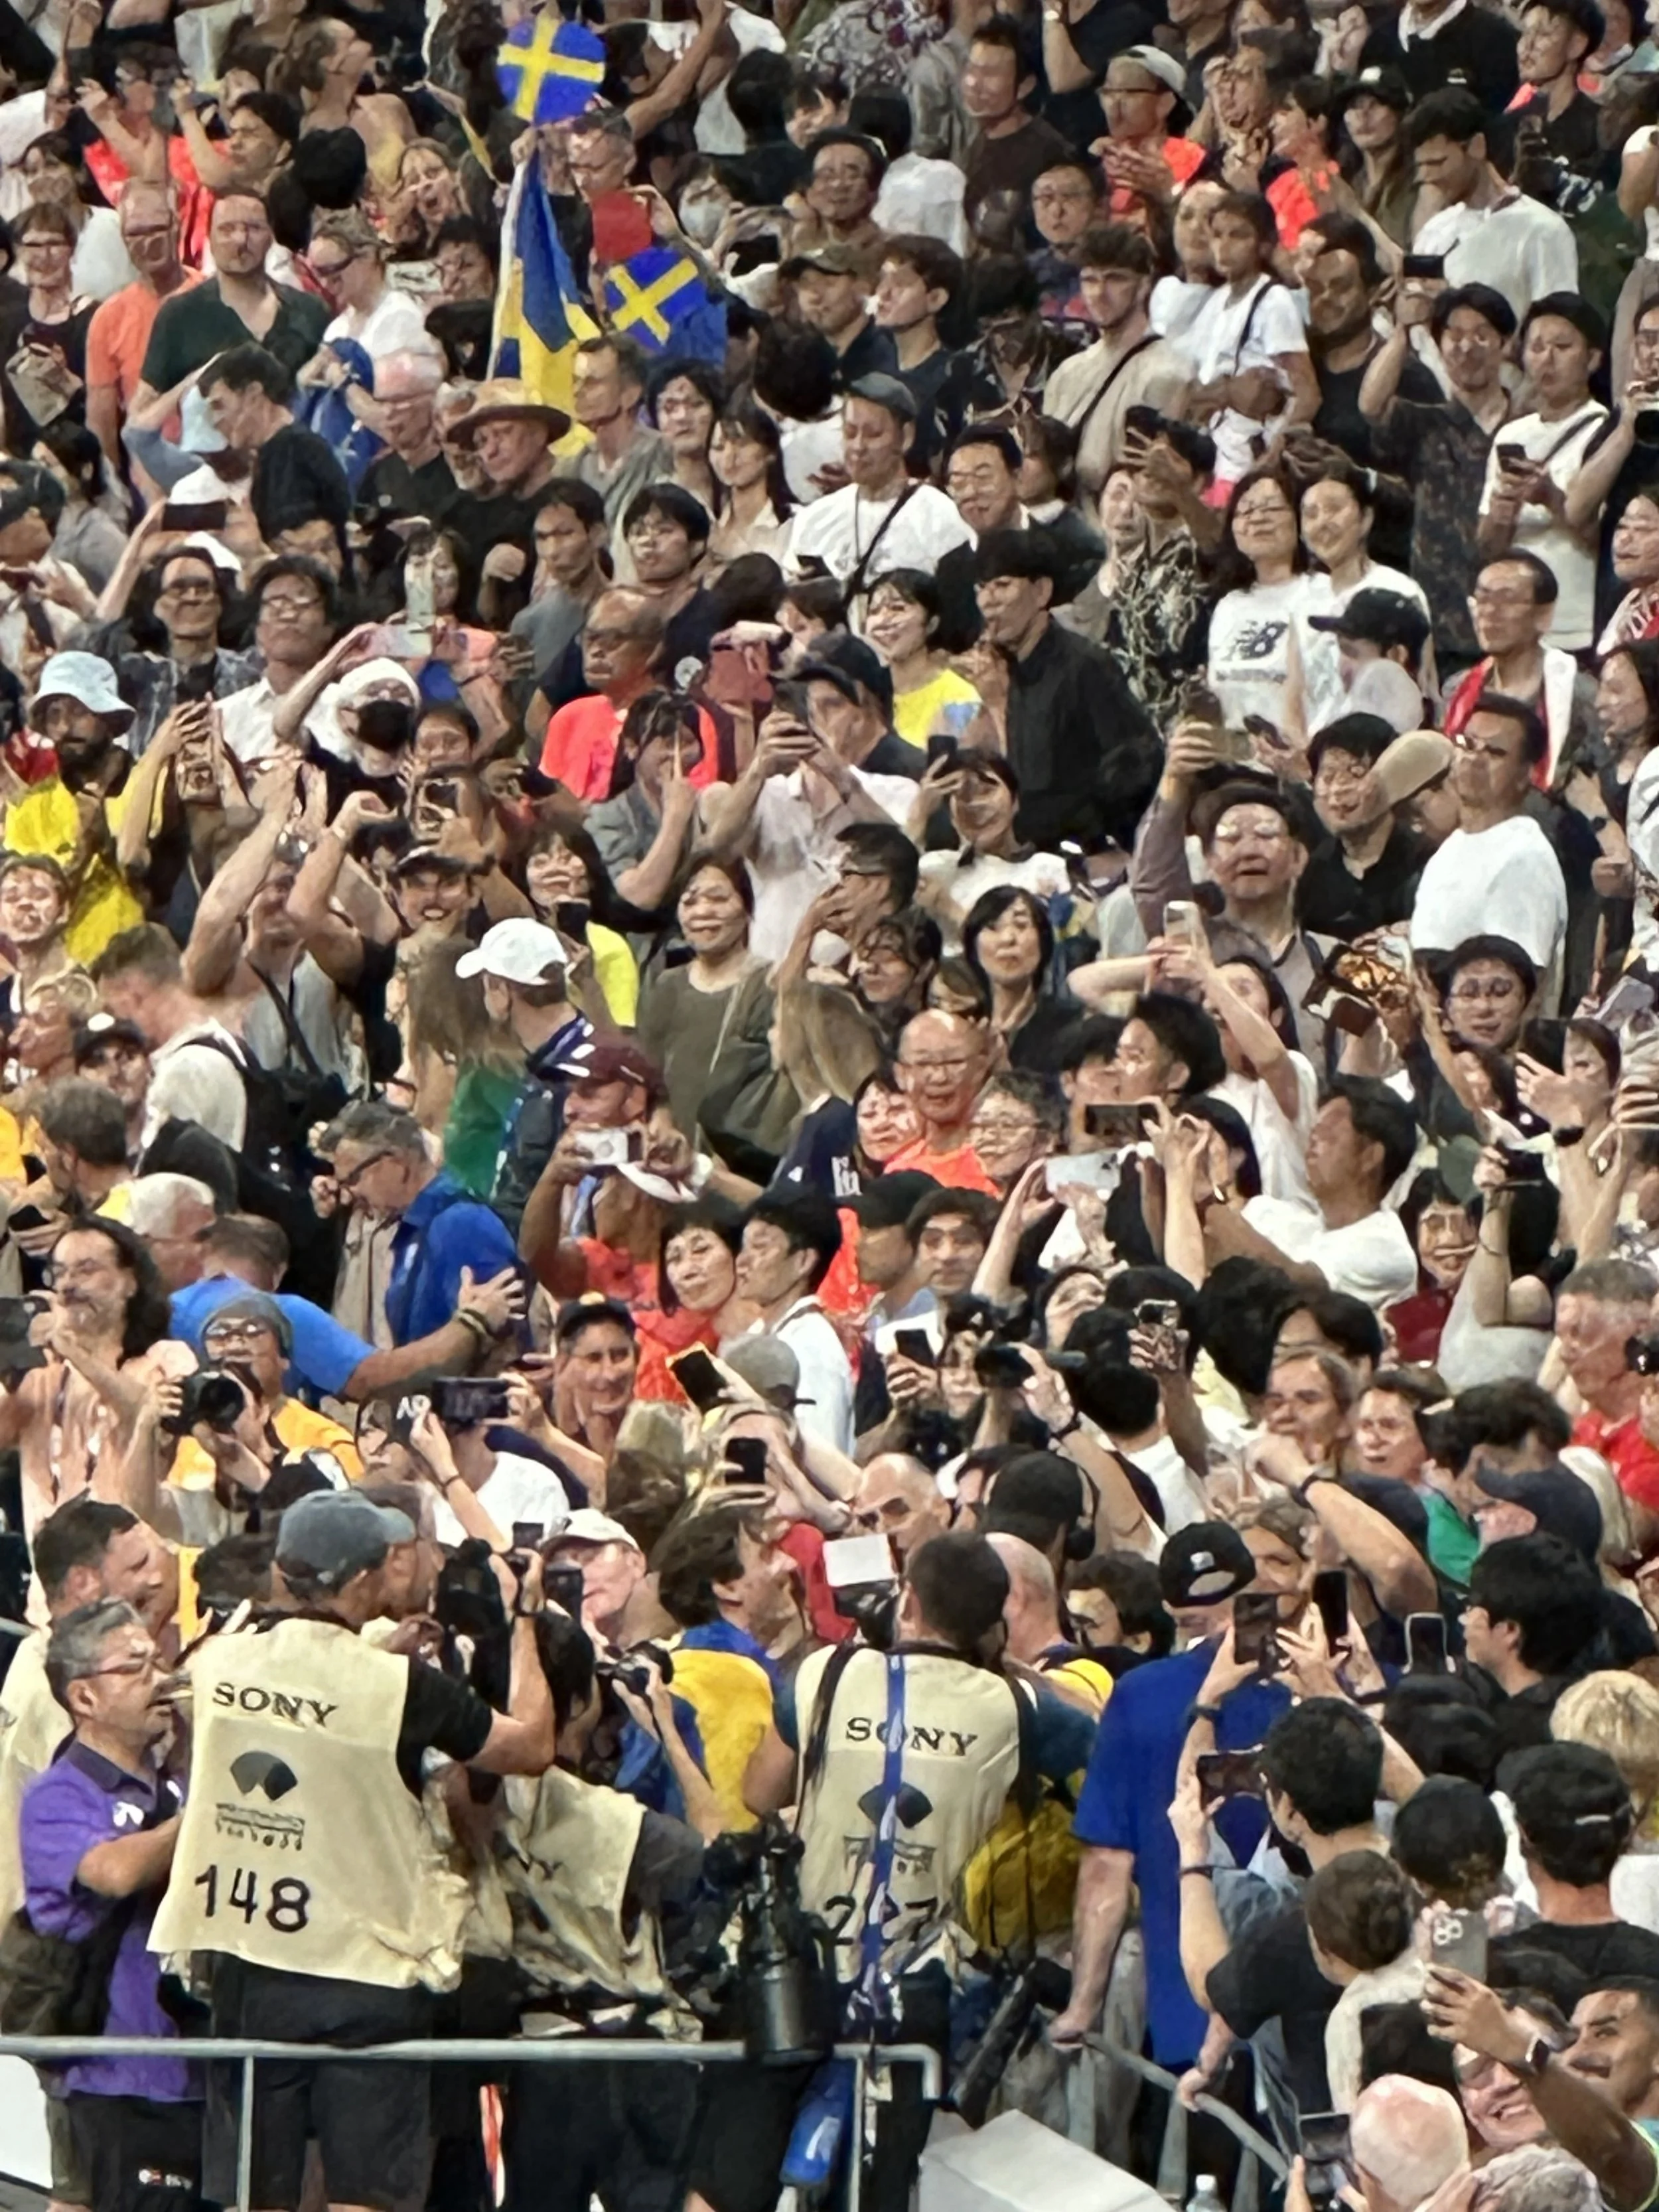
Where is Waldo?
The pole vault, though, delivered beyond anything I could have imagined. Armand Duplantis had dropped twice from 6.30 and went for the third attempt. Before he even started his run to the vault, the entire audience stood up. There was a collective realisation — before the dash — that he was going to do it. And he did. The noise was extraordinary. Seconds later, he ran to the stands and hugged someone close to him in the crowd. I have a photo from roughly fifteen metres away that captures the moment.
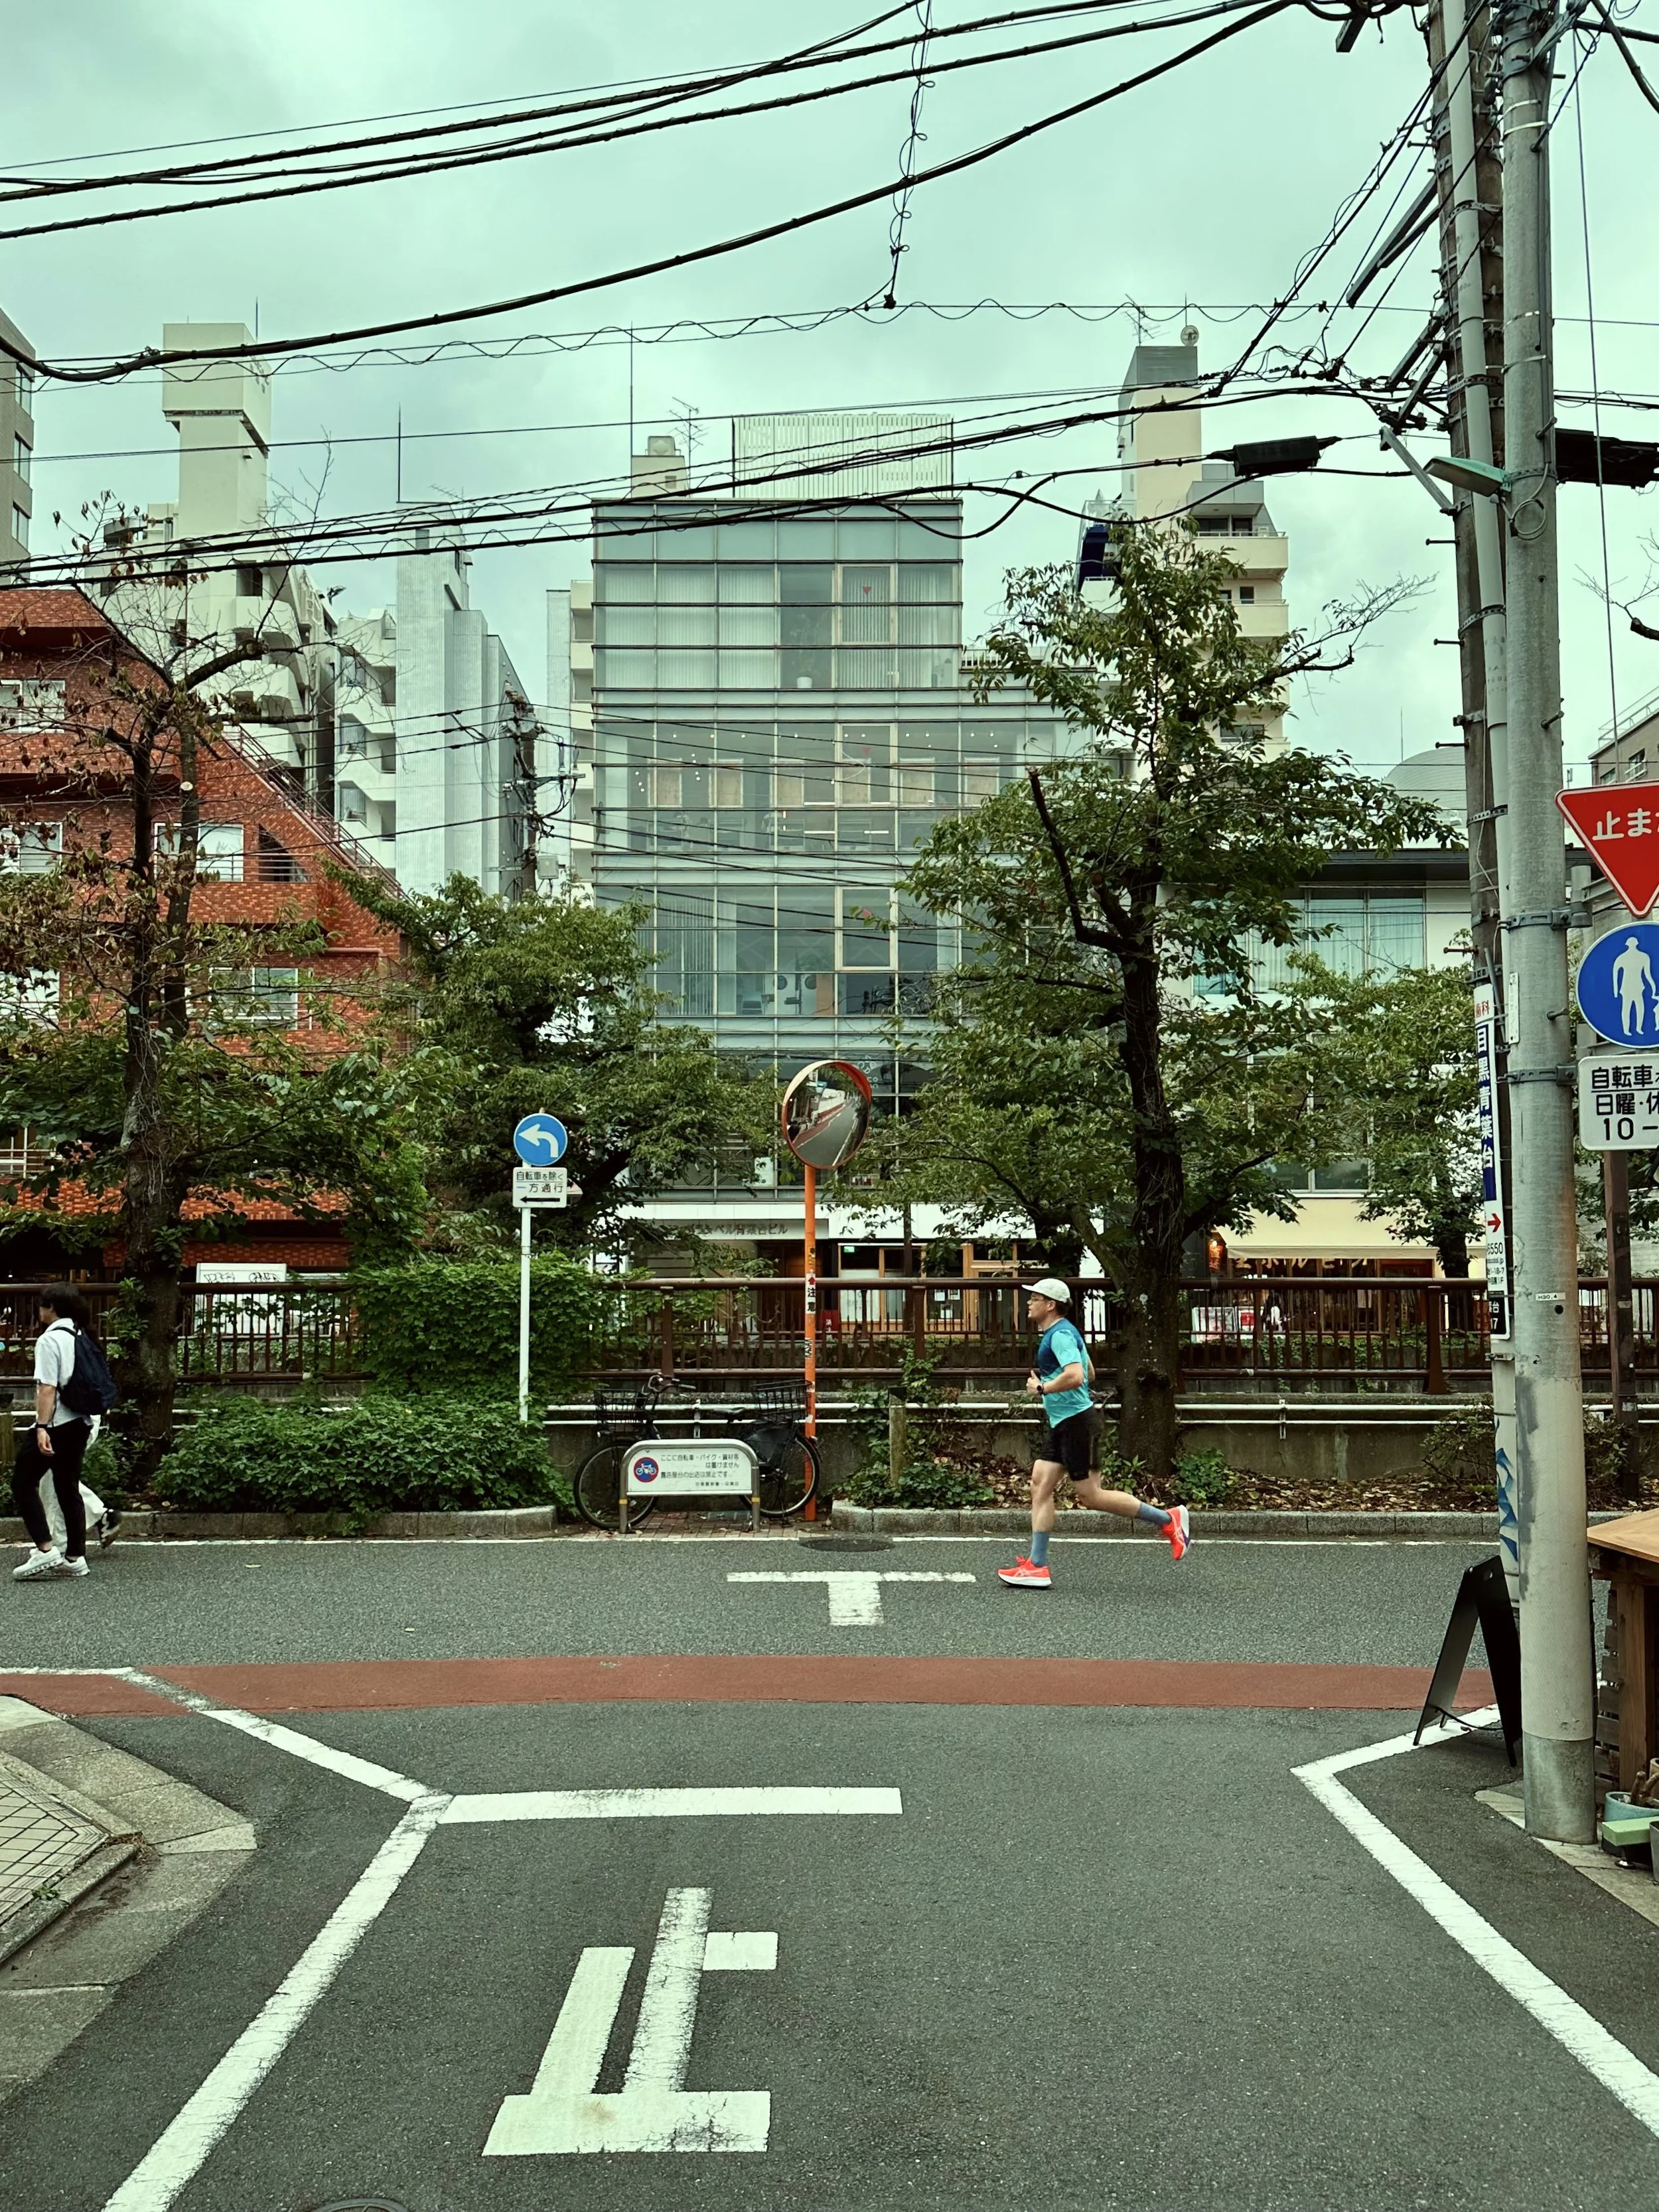
Between sessions
The days in Tokyo followed a pleasant rhythm. Mornings were for exploring and afternoons for resting before the long nights. One afternoon, between the morning session and the evening trip to the stadium, I went for a jog along the Meguro river. Tokyo is a spectacular city to run in: quiet residential streets open suddenly onto railway crossings, convenience stores appear every two hundred metres, and everything is spotlessly clean.
The heat, though, was relentless. As someone who spends professional time thinking about how temperature affects airways and athletic performance, I noticed things I might otherwise have ignored. Misting fans stationed around the stadium precinct. Athletes warming up in ice vests. The sheer volume of water bottles drained trackside after every session after athletes taking a sip before the race.
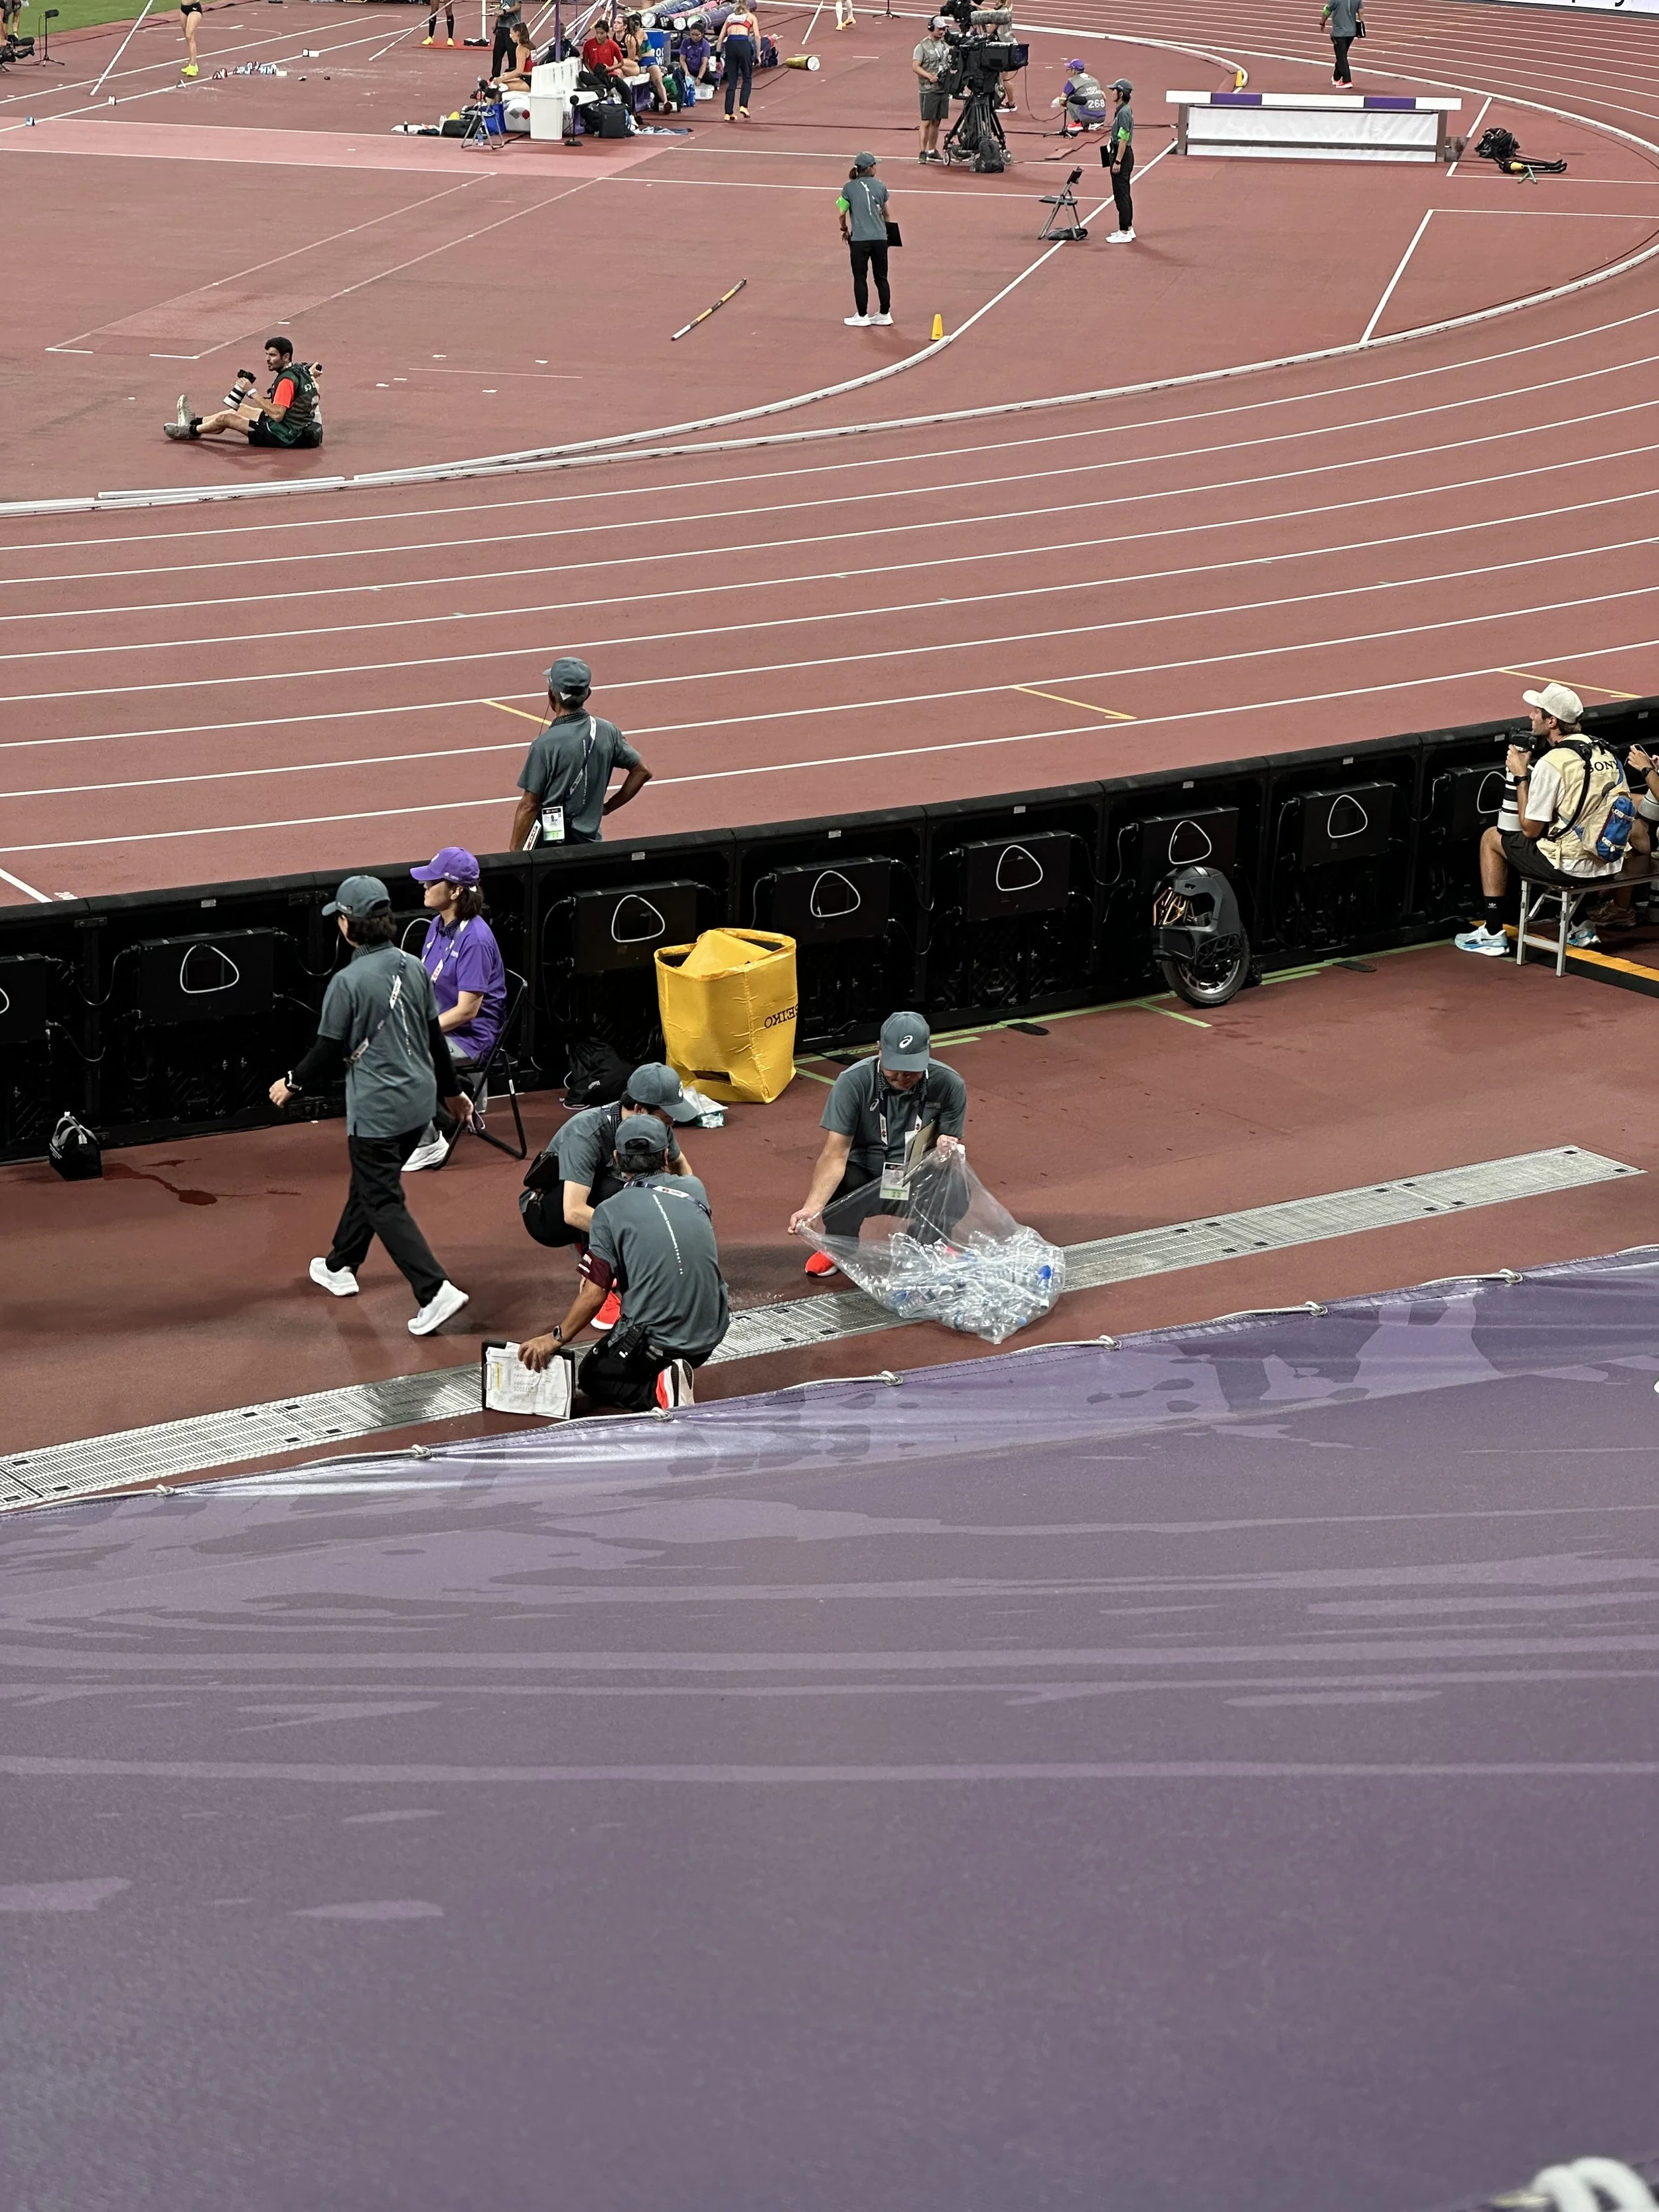
Tokyo in September is not a kind environment for endurance events, and the organisers clearly knew it.
The pub
Two nights that week, we ended up at Abbot's Choice in Shibuya — a pub with big screens showing replays of the day's events. There is something funny about watching a replay of the 5000 metres on Japanese television, where the graphics are overflowing with kanji and the commentary is completely unintelligible, while drinking a cold beer after a long day in the stadium. I recommend it.

The food
I have to mention the food because it was honestly a highlight on par with the athletics. Two places in particular:
Tenkazushi Shibuya Dogenzaka — a conveyor belt sushi restaurant where the plates come to you on a little belt and everything is fresh and absurdly cheap. Perfect for a quick meal between sessions.
Gyukatsu Motomura Shibuya — this is the one. Beef tonkatsu, not pork. You get a hot stone alongside your plate and sear the slices yourself to your preferred doneness. The sauce — I still think about that sauce. If you go to Tokyo and eat one meal, make it this one.
Hakone
We also made a day trip to Hakone for the onsens. I have been to two: Hakone Yuryo and Tenzan Onsen. Both are proper outdoor hot spring baths surrounded by forest. If I had to choose one, Hakone Yuryo is the better experience — quieter, more traditional, and the water feels like it has opinions about your well-being. It also has a proper sauna with a "sauna performance" and, inexplicably, an advertising TV inside.
After a week of stadium heat and city walking, soaking in a mountain hot spring felt like exactly the right way to decompress.
What I took home
No souvenirs, really. Just the memory of Duplantis floating over a bar that no human should be able to clear, the sound of a stadium holding its breath, and a persistent craving for that beef tonkatsu with the sauce.

Gravel riding the Secto Rally Finland routes in Jyväskylä
The gravel roads around Jyväskylä are world‑famous motorsport venues; every July–August they host a round of the World Rally Championship. Thanks to the rally, these roads are well maintained and rideable all year round (though in winter they’re snow‑ and ice‑covered).
If the rally drivers enjoy this gravel heaven, why shouldn’t we cyclists?
As a rider with a background in road cycling and cross‑country skiing, I used to stick to tarmac. When I moved back to Jyväskylä in 2024, however, most of my rides gravitated to gravel, and my route planning was heavily inspired by the rally stages winding through Central Finland’s forests. Rally‑Maps.com has been invaluable—almost every ride now includes at least one special stage, and the closest is only 2 km from my house in Laajavuori.
The idea behind this post is simply to share my excitement about riding these legendary stages week after week. This week, before the rally began, I rode three of them—finishing the last one just a day before the race. You could feel the buzz: fields and road‑sides decorated with signs, barrier tape and Finnish flags everywhere. It’s thrilling to pedal through a corner knowing that world‑class drivers will be tearing through it up to six times your speed in a matter of days.
Starting from Jyväskylä city centre and the Service Park in Lutakko, the closest special stage is the urban Harju Super Special in the heart of town. For 2025, the nearest forest stages (Laukaa and Ruuhimäki) are roughly 25 km from Service Park, while the furthest one, Västilä, is about 100 km away. That means you can roll out from your doorstep or hotel and be on a rally stage in no time.
If you want to ride all the stages, it’s sensible to split them into two loops:
Friday loop – 258 km
Ride Laukaa, Saarikas, Myhinpää and Ruuhimäki, then finish with Harju in the city.

In this natural chicane, Ott Tänak crashed into those trees just 24 hours later after this picture was taken.
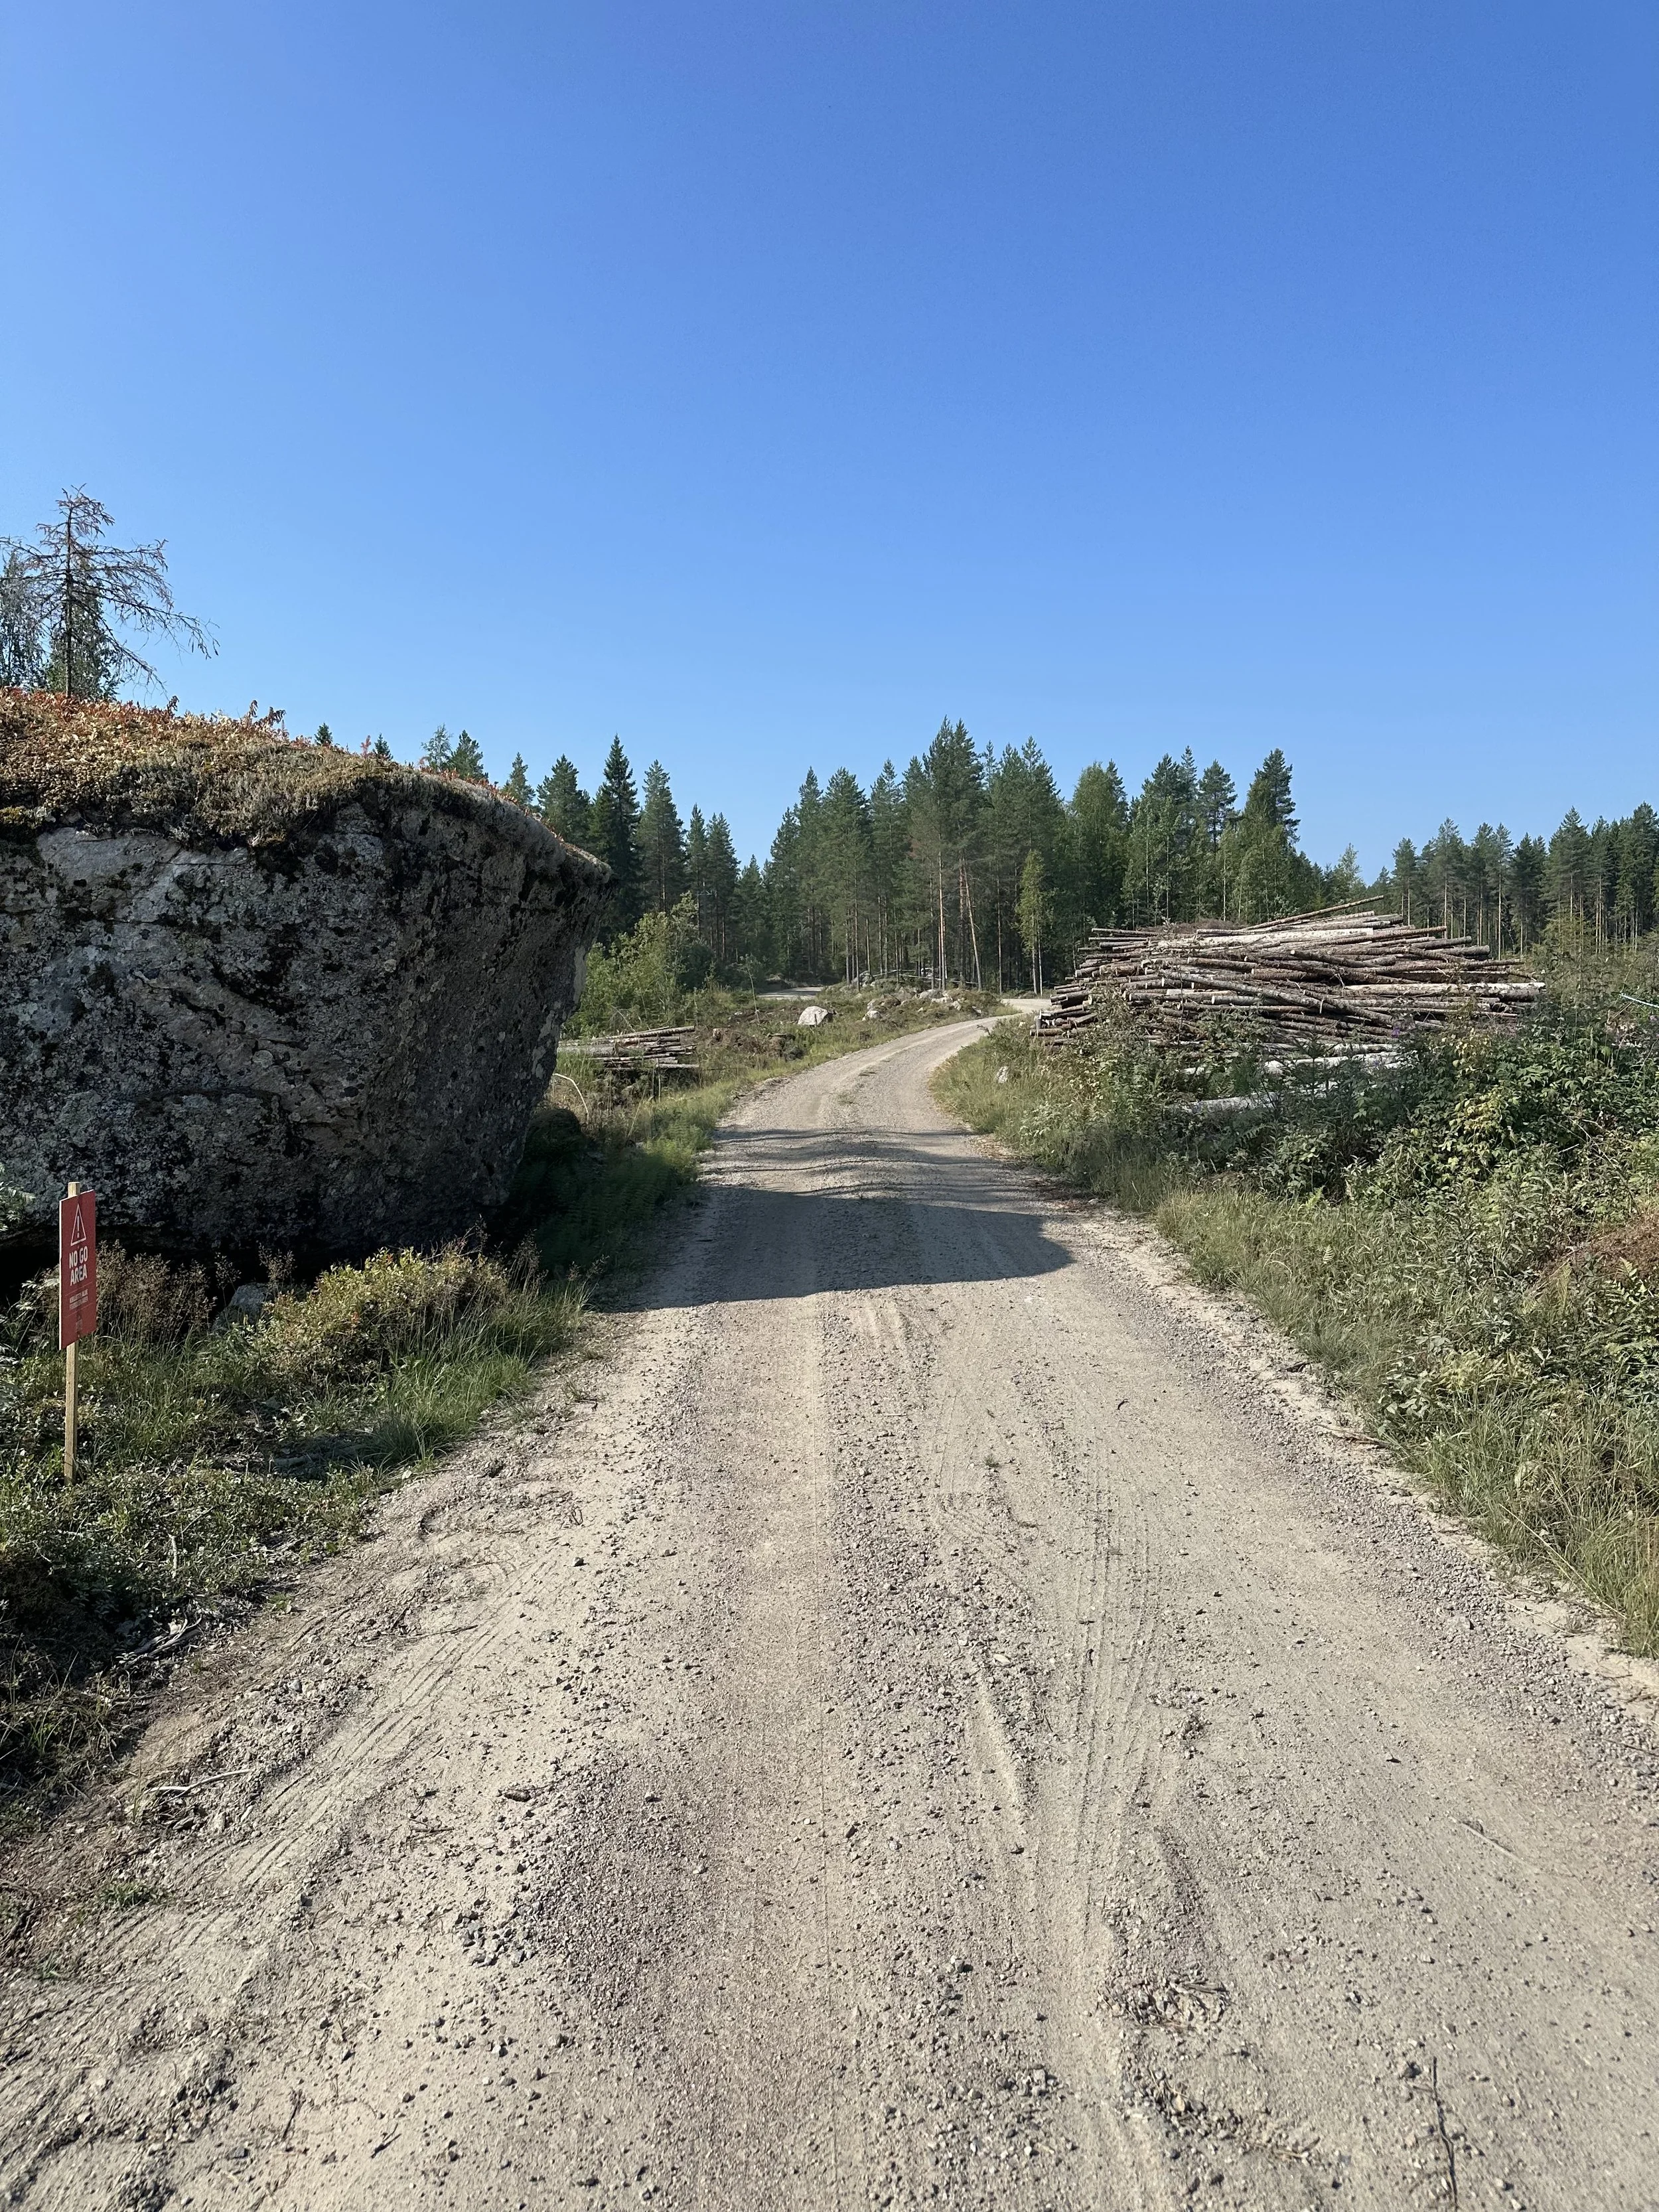
One kilometer later, very narrow roads with massive erratic blocks from the Ice Age just beside.
Saturday & Sunday loop – 306 km
This longer loop covers Parkkola, Västilä, Päijälä, Ouninpohja (Sunday’s power stage) and Leustu.
Between the special stages there are liaison sections, which run mostly on paved roads or wider gravel roads. When plotting the rides above, I tried to stick to gravel wherever practical and minimise time on major roads—though avoiding them entirely is impossible. Fortunately, the rally infrastructure means the gravel surfaces are generally in excellent condition; 40 mm tyres are plenty. Do make sure your gearing can handle steep climbs, because this landscape undulates a lot more than you might expect.
Since these rides would be monster rides, here is two that I rode just this week, just before the rally:
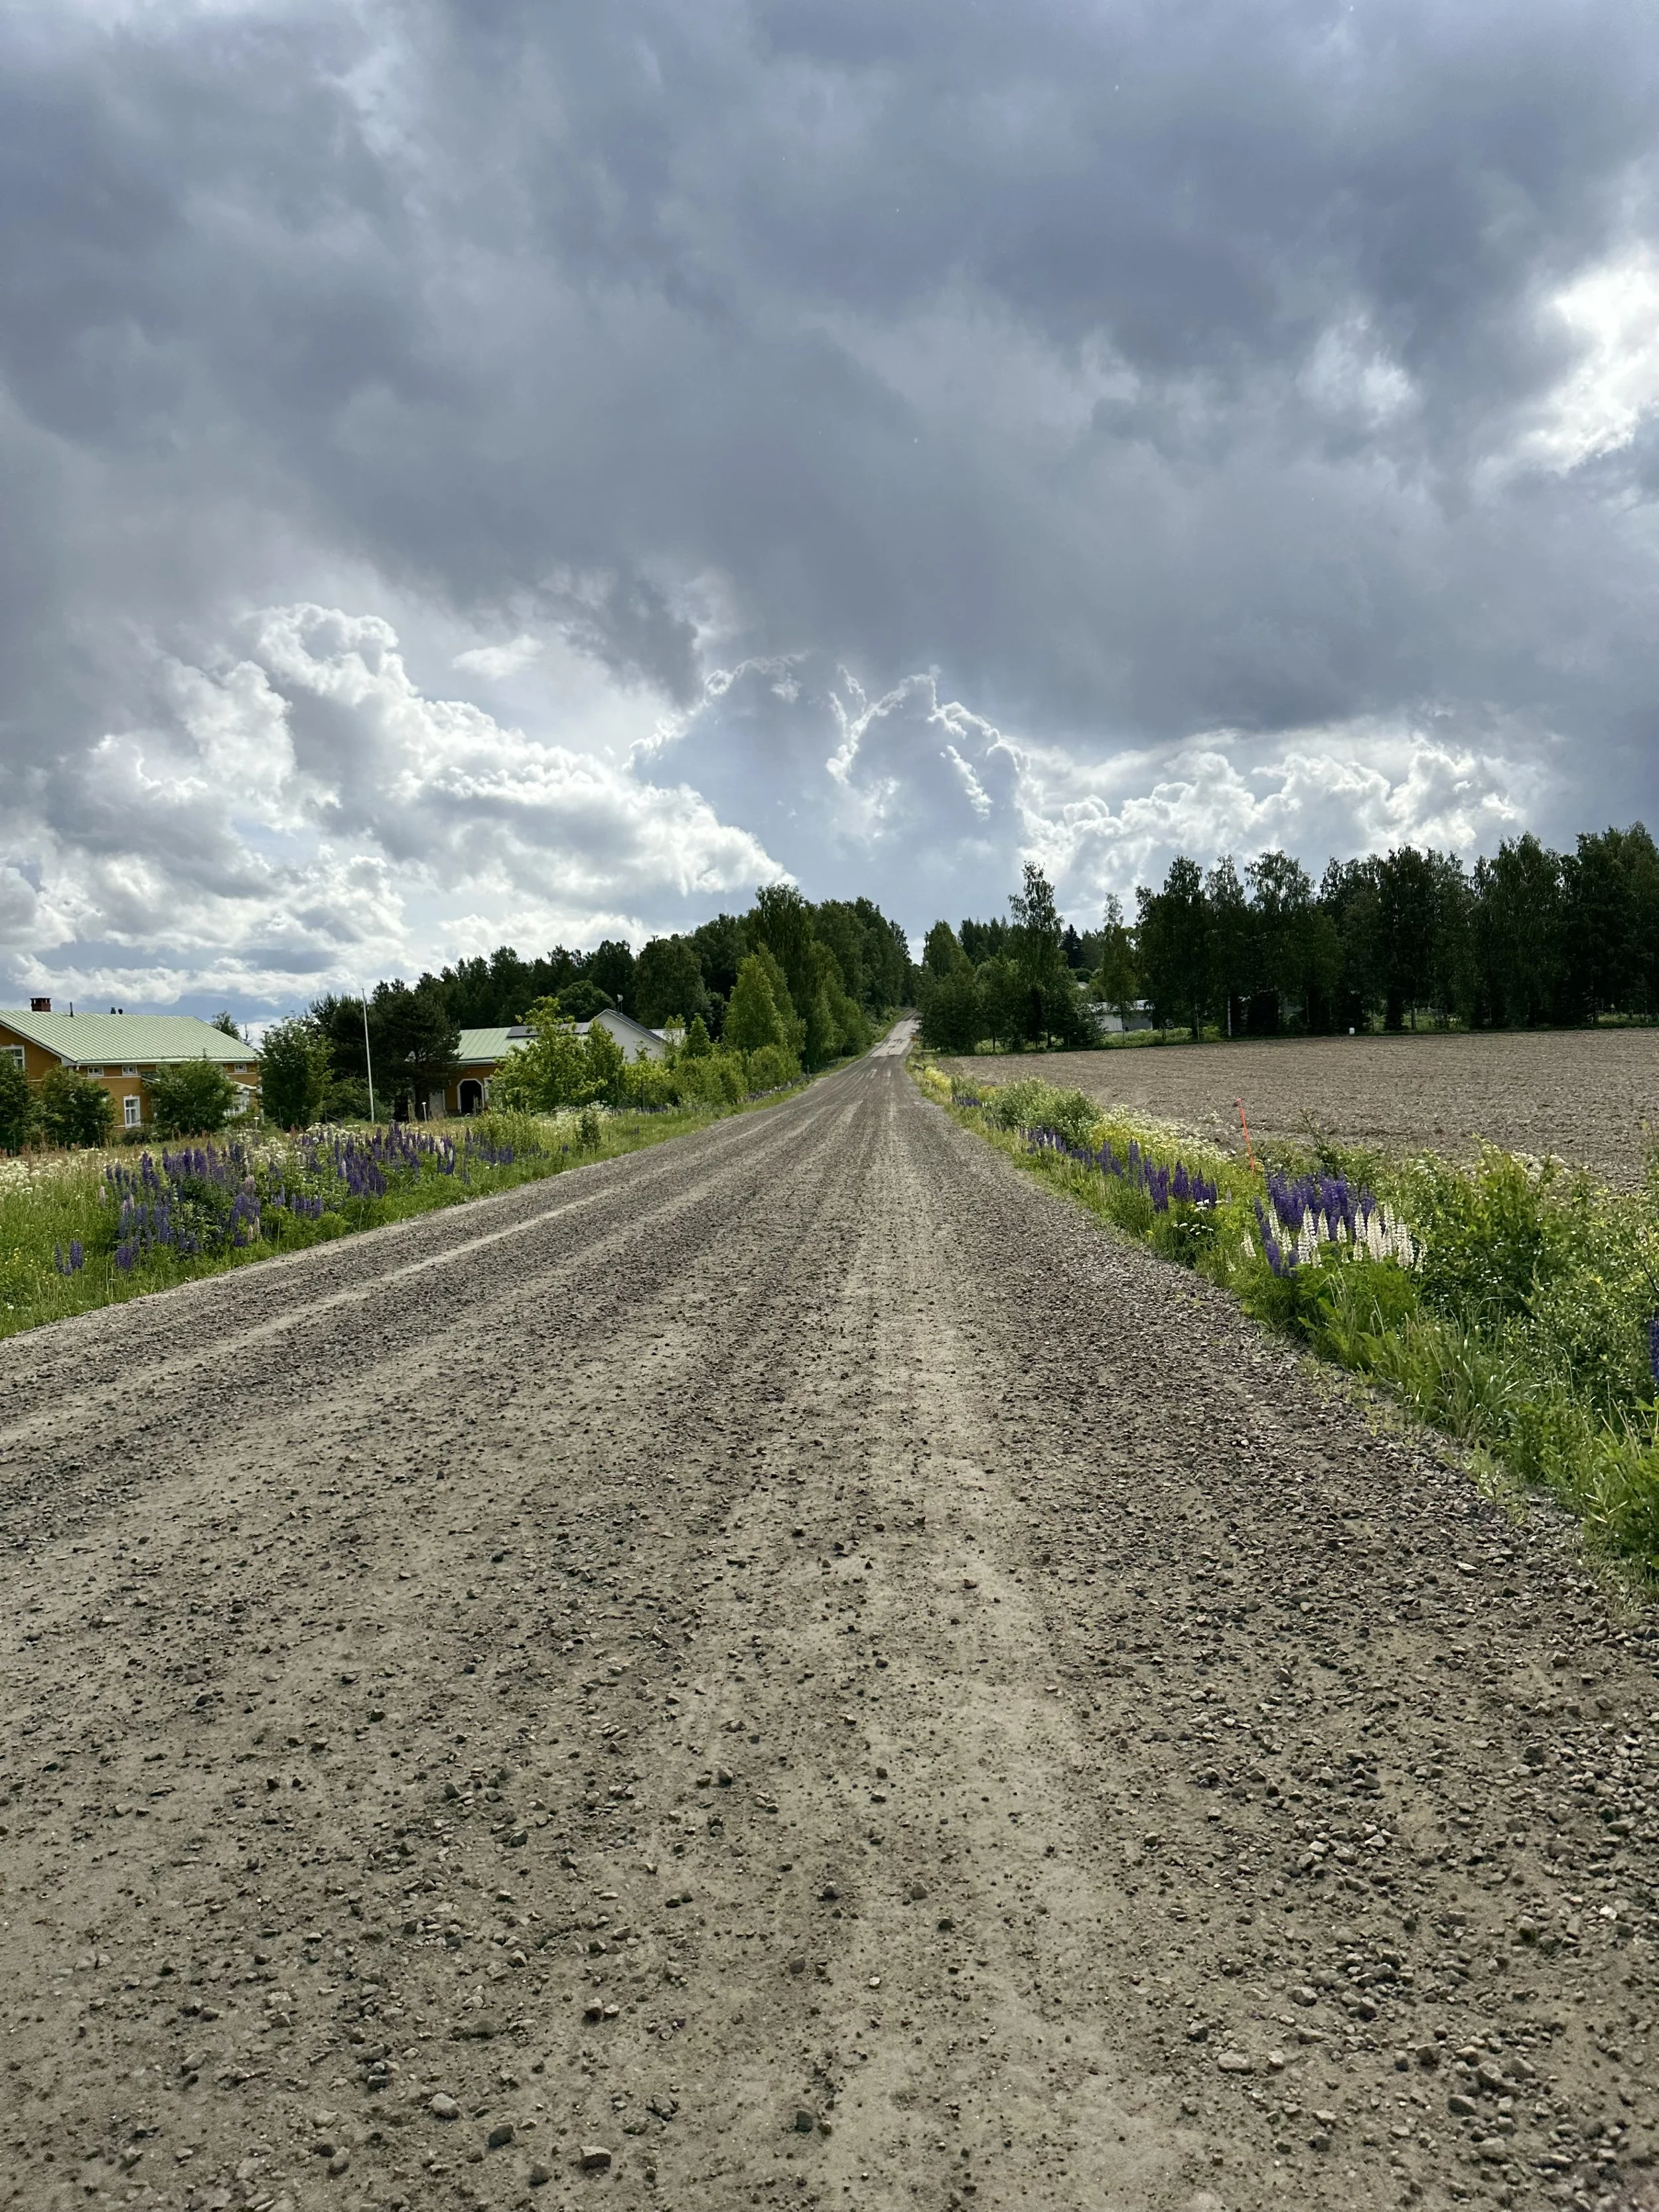
Recently maintained hard-packed gravel near Parkkola Super Stage.
These loops aren’t just about motorsport nostalgia. They link quiet villages, forests and lakes, so one minute you’re hurtling down a rally landmark, the next you’re cruising past a lake or stopping at a small summer café and yard sale in a sleepy hamlet. It’s this contrast—adrenaline and tranquillity—that makes gravel riding here so addictive.
Hopefully this plan inspires you to grab your handlebars and experience the magic of Jyväskylä’s rally roads at your own pace. Whether you’re a rally fan, a gravel addict or just looking for a new adventure, these stages deliver a ride you won’t forget.

Tools for Writing a Dissertation (and Studying)
Optimize your research workflow with essential tools for dissertation writing, efficient coding practices, AI integration, note-taking strategies, and effective use of reference management software.
Today, most of a researcher’s office work is conducted on a computer. Therefore, it is essential to have good, functional tools. In this article, I outline the research tools I currently use actively, and also mention software and workflows I have previously used but since abandoned.
With the advent of artificial intelligence, work methods are evolving rapidly, so note that I am writing this article during the Finnish July heatwave of 2025. These tips are intended for my seven-years-younger self starting a PhD, aiming to help avoid unnecessary pitfalls.
There are countless research tools across various fields for various uses, and for context, I completed my dissertation at Tampere University on asthma among cross-country skiers. The dataset involved about 700 participants, and the largest individual data file was roughly 50 megabytes—a modest size for modern computers. The raw data was gathered through an electronic questionnaire.
Hardware
I bought my first Apple computer at age 15 and have used them ever since. I also once owned the very first iPhone, which wasn't even sold in Finland initially. I have remained loyal to Apple's ecosystem.
Today, even the cheapest available MacBook (with Apple's M1, M2, etc., processors) is sufficient for writing and basic coding with smaller datasets. This is the recommendation I give to students I supervise. Additionally, I use a 13-inch iPad.
Software
For the final preparation of articles, I used Microsoft Word provided by my university’s subscription, and presentations were created with PowerPoint. Initially, I used Excel for manipulating raw data and categorizing open-text responses. As my skills advanced, I increasingly moved directly into coding, avoiding manual handling of raw data.
Choosing the right reference management system from the start is crucial. I previously used Refworks and Mendeley, until finally finding "The One"—Zotero. Zotero is open-source, allows seamless PDF storage, and keeps all literature in one place.
I've tried several note-taking applications, starting with Apple’s Notes app, then experimenting with Evernote, Notion, and briefly Microsoft's note-taking software during my studies.
However, I found myself returning to Apple's Notes app, which now holds over 2,000 notes spanning both professional and personal life. Practically every noteworthy item is stored there. I have a physical notebook, too, but mainly use it for jotting down NFL football scores and other sports results.

Figure 1: I’m not sure at which end of this intelligence-distribution Gaussian curve I fall in this regard, but I am convinced that a simple note-taking app makes work clearer. (Image source)
Coding
A doctoral candidate is likely to learn a new language—often a programming language. At Tampere Medical School, SPSS was taught during the second year, and we prepared seminar papers and assignments using it. I also used SPSS for my first two articles but found it cumbersome, particularly regarding high-quality visualizations.
After a few years with SPSS, I became enthusiastic about R, one of the most popular languages among scientists. With R, you can handle data, analyze it, and prepare publication-ready material from start to finish. The emergence of AI, particularly ChatGPT, drastically increased my coding productivity. I use R through RStudio, which is free for small-scale use.
I strongly recommend new researchers start learning R immediately, and I advocate teaching it as the primary language at medical schools. Although SPSS might initially be easier, R offers far greater versatility. However, I haven't yet explored Python.
Listening to experienced programmers has reinforced a recurring thought: Can you truly learn a language without writing it yourself?
Currently, my honest skill level includes:
Knowing the steps needed to process small, locally stored datasets from raw data to final results.
Understanding what packages, actions, and code are needed.
Interpreting code written by ChatGPT and understanding each part.
My biggest weakness: Struggling to identify and fix errors independently.
Not knowing what I don't know—potentially better or more efficient methods than AI initially suggests.
Three practical tips for writing
Paid AI Tools
I've subscribed to ChatGPT for two years now, using a business plan (approximately €55/month as of July 2025). The biggest advantage comes from coding, with the subscription proving its value after just a few hours of coding sessions at my skill level.
AI is also helpful for English language refinement and proofreading, enhancing clarity and readability. However, I often remove half of its suggestions. A useful prompt for concise and clear text is: "Act as an academic assistant writer to a grumpy, blunt, and honest Finnish professor who knows not everything is certain."
I'm awaiting the day AI operates locally and securely enough for me to confidently upload research data. Despite ChatGPT's assurances of privacy for business users, we're not there yet. Currently, a few language models can run locally, but laptops lack sufficient power for effective use.
Research Diary
I have one massive note where I compile extensive notes with to-do lists, daily progress, and ongoing observations in.a chronological order. Generally, I never delete anything—not even scattered thoughts or incomplete observations.
Text to Speech (TTS)
Machine-generated voices have improved dramatically, with the best models sounding realistic and comfortable for extended listening. Currently, I mostly use Apple's built-in accessibility features, which read screen content aloud. Any book instantly becomes an audiobook without needing physical interaction—even automatically turning pages when reading e-books.
I've tried paid TTS apps like Speechify, featuring voices like Snoop Dogg and Barack Obama, but found it buggy, particularly with multi-column PDF articles. The price (~$12/month) led me to end my subscription after a year (tried 2023–2024).
Conclusion
When choosing computers and software, invest in tools that eliminate waiting time, leaving the technology to await your commands, not vice versa. I also appreciate easy-to-use software that allows quick initial use and has the depth for efficient, advanced functionality.
Enjoy your work!

How to Win in Ruka World Cup Sprint – The Battle of the Final Hill

A compilation video on one of the longest running sprint races in the Cross Country World Cup, the Ruka sprint. The video presents finals from 2009, offering insights into key moments and strategies where races are often decided on the final hill.
In the 17-year history of Ruka sprint and 34 finals, 24 of them could still be found on YouTube. Despite the track is short, it is one of the toughest: the last minute is everything.
150 m long final uphill with 14% incline leading to the stadium is a run for the money. Most of the races are decided in that hill and only sometimes the leader has changed in the final straight.
The tempo has changed massively through the years. The demands in strength and agility have increased speeds specifically in running up the hill and hammering that double poling in the final straight. The tactics have been always quite simple: have a good spot before the hill and then the strongest will (almost) always win.
All Winners in Ruka Sprint through the years:
2022-2023
Emma Ribom
Johannes Hoesflot Klaebo
2021-2022
Maja Dahlqvist
Alexander Terentev
2020-2021
Linn Svahn
Erik Valnes
2019-2020
Maiken Caspersen Falla
Johannes Hoesflot Klaebo
2018-2019
Yulia Belorukova
Alexander Bolshunov
2017-2018
Stina Nilsson
Johannes Hoesflot Klaebo
2016-2017
Stina Nilsson
Pal Golberg
2015-2016
Maiken Caspersen Falla
Sondre Turvoll Fossli
2014-2015
Marit Björgen
Eirik Brandsdal
2013-2014
Justyna Kowalczyk
Eirik Brandsdal
2012-2013
Marit Björgen
Nikita Kriukov
2011-2012 (videos missing)
Marit Björgen
Teodor Peterson
2010-2011
Marit Björgen
John Kristian Dahl (video missing)
2009-2010
Justyna Kowalczyk (video missing)
Ola Vigen Hattestad
2008-2009 (videos missing)
Petra Majdic
Ola Vigen Hattestad
2007-2008 (videos missing)
Petra Majdic
Johan Kjoelstad
2006-2007 (videos missing)
Petra Majdic
Jens Arne Svartedal